

A groundbreaking study by the Bank for International Settlements (BIS) has unearthed significant discrepancies in how onchain Bitcoin transfer values are measured, revealing that estimates can vary by as much as sixfold depending on the methodology employed. This finding, detailed in BIS Working Paper 1377, "Hidden Complexity: Measuring Stablecoin, Crypto, and Decentralised Finance Ecosystems," casts a spotlight on the inherent challenges in accurately quantifying activity within the burgeoning cryptocurrency landscape. The research specifically addresses onchain transfer values, distinct from trading volumes executed on centralized crypto exchanges. The substantial sixfold gap observed is attributed to fundamental differences in how transactions are interpreted, particularly concerning the treatment of "change outputs" and other transfers that loop back to the original sender.
The root of this measurement complexity lies within the fundamental architecture of Bitcoin transactions. When a user initiates a Bitcoin transfer, the blockchain records the inputs (UTXOs or Unspent Transaction Outputs) that are being spent. If the total value of the spent UTXOs exceeds the intended payment amount, the excess funds are returned to the sender as change. While this change output is a necessary component of the transaction mechanism, its inclusion in onchain value calculations can inflate the perceived economic activity. Depending on the chosen measurement approach, these change outputs can be inadvertently counted as distinct transfers to another party, thereby artificially boosting the total reported value of onchain transactions. This phenomenon highlights a critical need for greater standardization and clarity in cryptocurrency data analysis.
Understanding the Nuances of Bitcoin Transactions
To grasp the BIS study’s findings, it’s essential to understand the mechanics of a Bitcoin transaction. Imagine Alice wants to send 1 Bitcoin (BTC) to Bob. Alice might have two UTXOs in her wallet: one worth 0.8 BTC and another worth 0.5 BTC. To send 1 BTC to Bob, Alice would select both UTXOs, totaling 1.3 BTC. She would then specify 1 BTC to be sent to Bob’s address and the remaining 0.3 BTC would be returned to her own address as change.
The divergence in reported transfer values emerges from how analysts treat this 0.3 BTC change. Some methodologies focus solely on the value sent to a new, distinct address (the 1 BTC to Bob), while others include all outputs of a transaction, even if they are returned to the sender. When this latter approach is adopted, the total recorded value for this single transaction would be 1.3 BTC (1 BTC to Bob + 0.3 BTC change back to Alice), rather than the 1 BTC that actually left Alice’s direct control and was intended for a new recipient. Over millions of such transactions daily, this seemingly minor detail can accumulate to create vastly different aggregate figures for the total value transferred on the Bitcoin network.
The BIS researchers emphasized this point directly in their paper: "Metrics such as transaction volumes, market capitalisation and total value locked often suggest a degree of accuracy that is not supported by the nature of the underlying data." This statement underscores a broader concern within the crypto analytics space: the potential for misleading narratives driven by unrefined data.
Beyond Transfer Values: Market Capitalization Discrepancies

The measurement challenges identified by the BIS extend beyond onchain transfer values to fundamental metrics like market capitalization. The study revealed that the conventional method of calculating Bitcoin’s market cap, which involves multiplying the total circulating supply by the current spot price, can significantly overstate the "realized capitalization." Realized capitalization, a more conservative metric, values each coin at the price it was last transacted. According to the BIS findings, this conventional market capitalization measure has at times been as much as four times higher than its realized counterpart. This substantial difference suggests that a significant portion of Bitcoin’s supply may not have moved recently, or that older, potentially less liquid coins are being valued at current market highs.
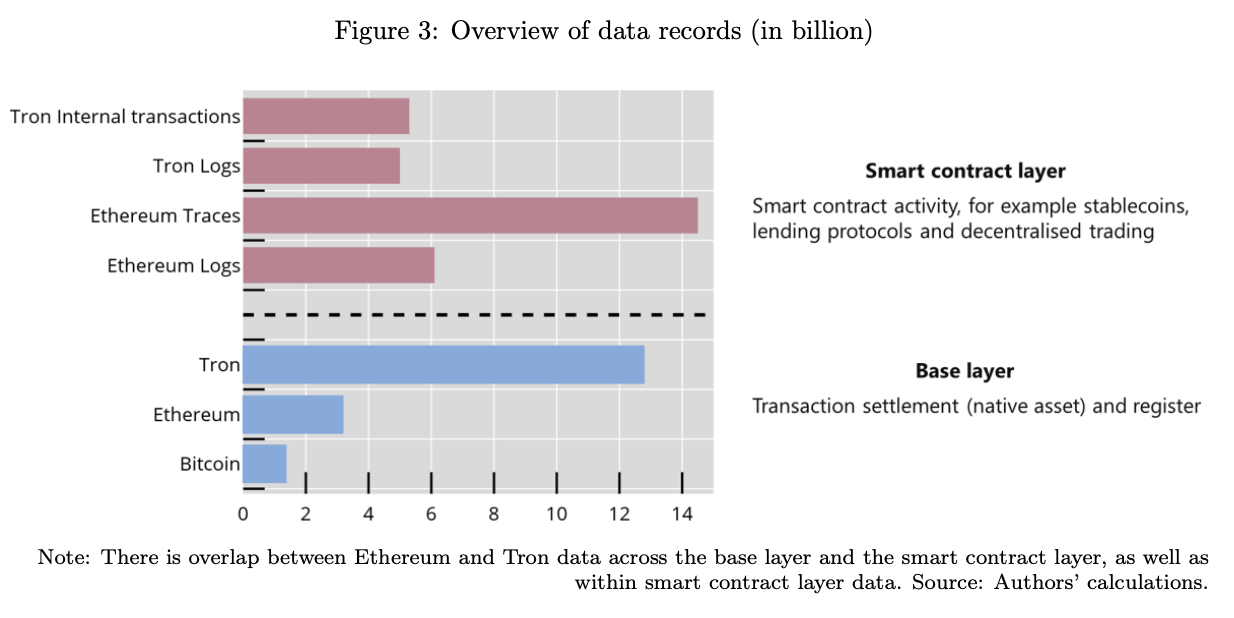
The study’s comprehensive analysis was based on an examination of 100 billion blockchain records spanning Bitcoin, Ethereum, and Tron. This extensive dataset allowed the researchers to identify consistent patterns of measurement challenges across these prominent blockchain networks, indicating that these issues are not isolated to Bitcoin but are systemic within the broader cryptocurrency ecosystem.
Ethereum and Stablecoins: Unique Measurement Hurdles
The complexity of measuring onchain activity intensifies when moving beyond Bitcoin to other prominent blockchain ecosystems like Ethereum and when analyzing the behavior of stablecoins. Ethereum, with its robust smart contract functionality, presents a distinct set of analytical challenges. The BIS study noted that out of approximately 67.5 million active smart contracts examined, a staggering 54 million could not be categorized using the classifications employed in the research. This inability to categorize a vast majority of active contracts suggests a significant gap in our understanding of the economic activity occurring within Ethereum’s decentralized application (dApp) layer.
Interpreting the activity of stablecoins, such as Tether (USDT) and USD Coin (USDC), adds another layer of difficulty. The same stablecoin asset can serve vastly different purposes across different blockchains. For instance, the BIS observed that USDT on the Ethereum network was more closely associated with decentralized finance (DeFi) activities, such as providing liquidity to decentralized exchanges or participating in lending protocols. In contrast, USDT on the Tron network was predominantly linked to payment-like transactions and acting as a store of value, reflecting its use in cross-border remittances or as a stable medium of exchange in certain regions.
These distinct use cases become particularly evident when examining asset holdings. The study highlighted that in 2022, the share of USDT held by smart contracts on Ethereum exceeded 20%, indicating its deep integration into DeFi protocols. Conversely, on the Tron network, this figure was only around 1%. The researchers concluded that aggregating USDT activity across different blockchains without accounting for these divergent use cases can lead to a conflation of different types of economic activity. This obscures the true nature of how stablecoins are being utilized and can present a distorted picture of their role in the broader financial landscape.
The BIS researchers’ overarching conclusion from their extensive analysis is that onchain indicators should be approached with caution, viewed as "noisy approximations rather than direct measures of economic activity." This cautionary stance is crucial for policymakers, investors, and researchers seeking to understand the real-world impact and scale of blockchain-based economies.
Evolving Data Analysis: Visa’s Approach to Stablecoin Metrics
In recognition of these measurement challenges, some data analytics providers are actively developing methodologies to provide a more refined view of onchain activity. Visa, a global leader in digital payments, has taken a proactive approach through its Onchain Analytics platform, powered by data from Allium Labs. This platform distinguishes between raw blockchain data and adjusted measures specifically designed to better reflect genuine economic activity.
Visa’s adjusted methodology aims to filter out potential distortions arising from various onchain phenomena. These include high-frequency trading, automated bot activity, the routing of transactions through cross-chain bridges, and internal operations within centralized exchanges. By accounting for these factors, Visa seeks to present a clearer picture of the stablecoin transactions that represent actual economic value transfer between distinct entities, rather than purely technical or automated processes.
The Visa Onchain Analytics dashboard currently illustrates the significant divergence between raw and adjusted data. Over the past 30 days, the platform reported a total stablecoin transaction volume of $6.4 trillion across the networks it tracks. In stark contrast, the adjusted volume, which aims to capture more economically meaningful transactions, stood at a substantially lower $313.1 billion. This nearly twentyfold difference underscores the impact of the measurement issues highlighted by the BIS and the value of employing sophisticated filtering techniques.
Implications for the Crypto Ecosystem and Beyond
The BIS study’s findings have profound implications for various stakeholders:
- Investors and Traders: A clearer understanding of data measurement nuances can lead to more informed investment decisions. Relying on potentially inflated onchain metrics could misrepresent the true scale and activity of crypto assets.
- Regulators and Policymakers: Accurate data is fundamental for effective regulation. The BIS research suggests that regulators need to be aware of the limitations of current onchain data when assessing market size, systemic risk, and compliance. This could influence how digital assets are categorized and overseen.
- Developers and Researchers: The study highlights a critical need for standardization in data reporting and analysis within the blockchain space. Developing common protocols for defining and measuring onchain activity could foster greater trust and comparability.
- Financial Institutions: For traditional financial institutions exploring integration with the crypto space, understanding these data complexities is vital for risk management, compliance, and the development of reliable analytics tools.
The BIS’s work is a crucial step in demystifying the complexities of blockchain data. As the digital asset landscape continues to evolve, so too must the tools and methodologies used to measure and understand its economic impact. The ongoing efforts by entities like Visa to refine data analysis represent a positive trend towards greater transparency and accuracy in this rapidly developing sector. The challenge now lies in broader adoption and standardization of these more nuanced approaches to data interpretation. The BIS study serves as a critical reminder that beneath the surface of seemingly straightforward blockchain metrics lies a hidden complexity that demands careful consideration and rigorous analysis.

