
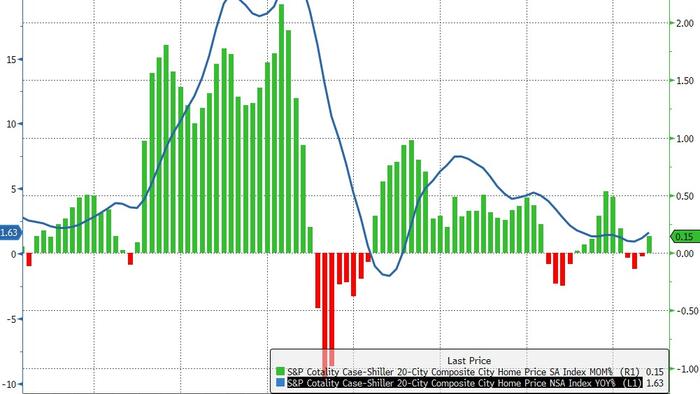
United States home prices demonstrated an unexpected resurgence in May, according to the latest data from the S&P CoreLogic Case-Shiller Home Price Index, defying projections of continued stagnation or marginal growth. After three consecutive months of decline, analysts had anticipated a modest 0.1% month-over-month increase in the 20-City Composite Index. Instead, the index accelerated by a robust 0.3% month-over-month, leading to an annual appreciation of 1.63% year-over-year. This marked the fastest annual price gain observed since July 2025, signaling a potential turning point in the nation’s housing market dynamics, albeit one fraught with underlying challenges related to affordability and persistent inflation.
Understanding the S&P CoreLogic Case-Shiller Index
The S&P CoreLogic Case-Shiller Home Price Index is a leading measure of residential real estate values in the United States, widely recognized for its robust methodology. It tracks changes in the value of residential real estate nationally and in 20 major metropolitan regions, using a repeat-sales index calculation. This approach compares the sales price of the same home over time, offering a more accurate gauge of pure price appreciation by filtering out the effects of changes in housing quality or type. The index includes both a National Home Price Index, and 10-City and 20-City Composite Indices, providing a comprehensive view of the market. The data, however, operates with a lag, reflecting transaction closings that occurred several months prior to the report’s release. For instance, the May data typically encompasses sales from March and April, meaning it may not fully capture the most immediate shifts in market sentiment or interest rates.
The May Rebound: Key Figures and Seasonal Influences
The 0.3% month-over-month increase in the 20-City Composite Index was a notable deviation from expectations, pushing the annual appreciation rate to 1.63%. This upward movement was largely attributed to the robust performance of the housing market during the traditional spring homebuying season. Rebecca Kaufman, Associate Director of Commodities at S&P Dow Jones Indices, highlighted this seasonal strength, observing, "Monthly price appreciation continues to reflect the seasonal strength often associated with the spring homebuying season."
A deeper dive into the data reveals the significant influence of these seasonal factors. On a non-seasonally adjusted (NSA) basis, the National Index registered a more substantial 0.6% increase in May from April. Similarly, the 10-City and 20-City Composites each advanced by a stronger 0.9% without seasonal adjustments. However, when accounting for typical seasonal variations, the picture became more nuanced. The National Index actually declined marginally by 0.05% month-over-month on a seasonally adjusted (SA) basis. The 10-City and 20-City Composites, while still positive, posted more modest seasonally adjusted gains of 0.3% and 0.2%, respectively.
Kaufman elaborated on this disparity, stating, "The gap between the NSA and seasonally adjusted results underscores the extent to which seasonal factors are supporting headline price growth." This distinction is crucial for understanding the market’s underlying health. While headline figures showed growth, the seasonally adjusted data suggests that once the boost from the spring buying rush is stripped away, the market’s momentum is considerably more tempered. She further noted that even where prices increased on a seasonally adjusted basis, "gains remained modest and were negative in real terms," pointing to the persistent challenge of inflation eroding purchasing power.

Geographic Divergence: A Tale of Two Housing Markets
The national averages, however, mask a continuing trend of significant geographic dispersion in home price trends across the United States. The housing market is increasingly fragmented, with distinct regional performances driven by local economic conditions, inventory levels, and demographic shifts.
Major metropolitan areas in the Northeast and Midwest continued to demonstrate resilience, recording year-over-year gains that surpassed the national average. For the third consecutive month, Chicago emerged as the leading metro, posting an impressive 6.9% annual increase in May. This sustained growth in Chicago reflects a combination of factors, including relatively more affordable entry points compared to coastal cities, a stable job market, and perhaps a continuous influx of buyers seeking value. New York followed with a solid 4.2% annual appreciation, indicative of strong demand in a historically robust market, while Cleveland registered a healthy 3.1% gain. These markets, often characterized by more stable, less speculative growth patterns, appear to be weathering broader economic uncertainties more effectively.
Conversely, many metropolitan areas in the West and Sunbelt regions, which experienced explosive growth during the pandemic-era housing boom, continued to face downward pressure. Las Vegas posted the largest decline, with home prices falling 1.9% year-over-year. This reversal in fortunes for Las Vegas, a market heavily reliant on tourism and often prone to boom-bust cycles, highlights its sensitivity to rising interest rates and affordability constraints. Other notable decliners included Seattle (-1.8%), Denver (-1.8%), and Tampa (-1.6%). These cities, known for their high growth rates and tech-driven economies in recent years, are now grappling with higher inventory, a slowdown in migration, and affordability challenges that have become acute due to previously rapid price escalations. The significant outmigration from these areas during the peak of the pandemic housing boom has reversed in some instances, impacting local demand.

Mortgage Rates, Affordability, and the Federal Reserve’s Shadow
A critical factor shaping the current housing landscape is the persistent challenge of affordability, largely driven by elevated mortgage rates and stubbornly high inflation. The S&P CoreLogic Case-Shiller data, while showing a price rebound, reflects transactions that occurred when mortgage rates were still a significant headwind.
In May, the average 30-year fixed mortgage rate increased to 6.5%. This stands in stark contrast to the ultra-low 3% borrowing costs that characterized the pandemic-era market, which are now "a distant memory," as Kaufman aptly put it. The dramatic increase in borrowing costs has substantially eroded purchasing power for prospective homebuyers. A buyer qualifying for a $400,000 mortgage at 3% would have a monthly payment of approximately $1,686 (excluding taxes and insurance). At 6.5%, that same mortgage payment jumps to roughly $2,528, an increase of nearly 50%. This surge in monthly housing expenses, combined with persistently high inflation affecting other living costs, significantly constrains housing demand.
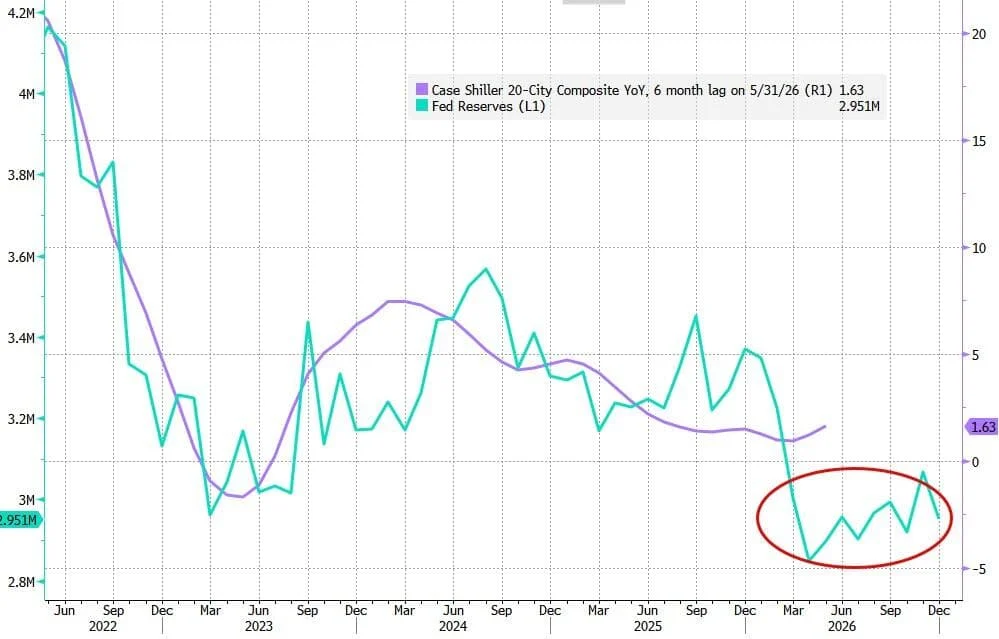
The trajectory of mortgage rates is intrinsically linked to the Federal Reserve’s monetary policy. The Fed’s aggressive campaign of interest rate hikes, initiated to combat inflation, has directly impacted the cost of borrowing across the economy, including mortgage rates. While the Case-Shiller data lags, the market continues to closely watch the Fed’s signals. The "oddly tight coupling" between home prices and the Federal Reserve’s reserves suggests that future home price movements could still be heavily influenced by the central bank’s actions. Should the Fed maintain a hawkish stance or signal further tightening, the upward momentum in home prices could be challenged. Conversely, any indication of future rate cuts could provide a much-needed boost to affordability and buyer sentiment.

The Erosion of Real Returns: Inflation Outpaces Home Price Growth
Perhaps one of the most significant, yet often overlooked, aspects of the current housing market is the ongoing erosion of real home price returns. For the twelfth consecutive month, inflation, as measured by the Consumer Price Index (CPI), outpaced the national home price appreciation. With the CPI running well above the 1.6% annual gain in home prices, homeowners are experiencing a "streak of negative real home price returns."
This means that while the nominal value of homes might be increasing, their purchasing power is actually declining when adjusted for inflation. For existing homeowners, this translates to a reduction in their real wealth. For prospective buyers, it means that even if nominal prices stabilize or decline slightly, the overall cost of living, including financing, is increasing, making homeownership less attainable. This phenomenon underscores the broader economic environment where inflationary pressures are not only impacting consumer goods but also diminishing the real value of significant assets like real estate. This sustained period of negative real returns could eventually weigh on consumer confidence and investment decisions in the housing sector.
Broader Market Context and Implications

The S&P CoreLogic Case-Shiller report provides a crucial piece of the housing market puzzle, but it’s important to view it within the context of other indicators. Data from the National Association of Realtors (NAR) on existing home sales, for instance, has shown fluctuations, often constrained by low inventory as homeowners with low mortgage rates are reluctant to sell and take on higher financing costs for a new home. New home sales and housing starts have also shown mixed signals, with builders facing challenges ranging from labor shortages to material costs, though some are offering incentives to attract buyers.
The May rebound, while encouraging on the surface, highlights the complexity and conflicting forces at play. On one hand, the persistent demand during the spring buying season, coupled with potentially limited inventory in certain desirable markets, is providing support for prices. On the other hand, the foundational issues of affordability, high mortgage rates, and elevated inflation continue to exert significant downward pressure.
Looking ahead, the future trajectory of U.S. home prices remains uncertain. While the May data suggests a stronger-than-expected rebound, analysts will be closely watching whether this momentum can be sustained beyond seasonal effects. Key factors to monitor include:
- Federal Reserve Policy: Any shifts in the Fed’s stance on interest rates will directly influence mortgage rates and, consequently, buyer demand and affordability.
- Inflation Trends: A significant cooling of inflation would ease pressure on real returns and potentially allow for more accommodative monetary policy.
- Inventory Levels: A sustained increase in housing inventory could temper price growth, especially in markets that previously saw rapid appreciation.
- Economic Growth and Employment: A strong labor market generally supports housing demand, but a downturn could quickly dampen it.
- Regional Dynamics: The divergence between robust markets in the Northeast/Midwest and struggling markets in the West/Sunbelt is likely to continue, necessitating a localized approach to understanding housing trends.
In conclusion, the May 2026 S&P CoreLogic Case-Shiller report painted a picture of a U.S. housing market experiencing a stronger-than-anticipated rebound, driven largely by seasonal factors. However, the underlying challenges of high mortgage rates, declining affordability, and the erosion of real returns due to persistent inflation continue to cast a long shadow. While the immediate data offers a glimmer of positive momentum, the market remains in a delicate balance, heavily influenced by broader macroeconomic forces and regional specificities.

