
The real estate market is undergoing a profound transformation, marking the definitive end of the era dominated by generic home search applications. For over a decade, the industry’s digital landscape was largely defined by platforms that primarily served as visual catalogs, displaying property photos and prices. However, the current market dynamics reveal a significant shift, with investors now playing a more dominant role than traditional homebuyers. This discerning user base no longer requires another property search engine; they demand a sophisticated "decision engine."
This fundamental pivot from passive property search to active investment analysis presents a substantial opportunity for entrepreneurial founders. By developing specialized, niche investment platforms, entrepreneurs can capture a high-value audience that is willing to invest in actionable data rather than simply browsing for free. This comprehensive guide serves as a blueprint for building a scalable and data-driven real estate investment application, delving into product strategy, technical architecture, and effective monetization models.
At its core, a successful real estate investment application requires a robust three-tiered architecture. The most efficient path to market involves integrating pre-calculated investment data via an API, allowing development teams to concentrate their engineering efforts on creating unique features and differentiating their product, rather than expending valuable resources on data cleaning and normalization.
The Strategic Pivot: Why Investment Grade Wins
A significant number of real estate technology (PropTech) startups falter by attempting to compete directly with established giants like Zillow on the sheer volume of property listings. This is a strategically unsound approach, as Zillow boasts extensive MLS contracts and billions in funding, making direct competition on inventory nearly impossible.
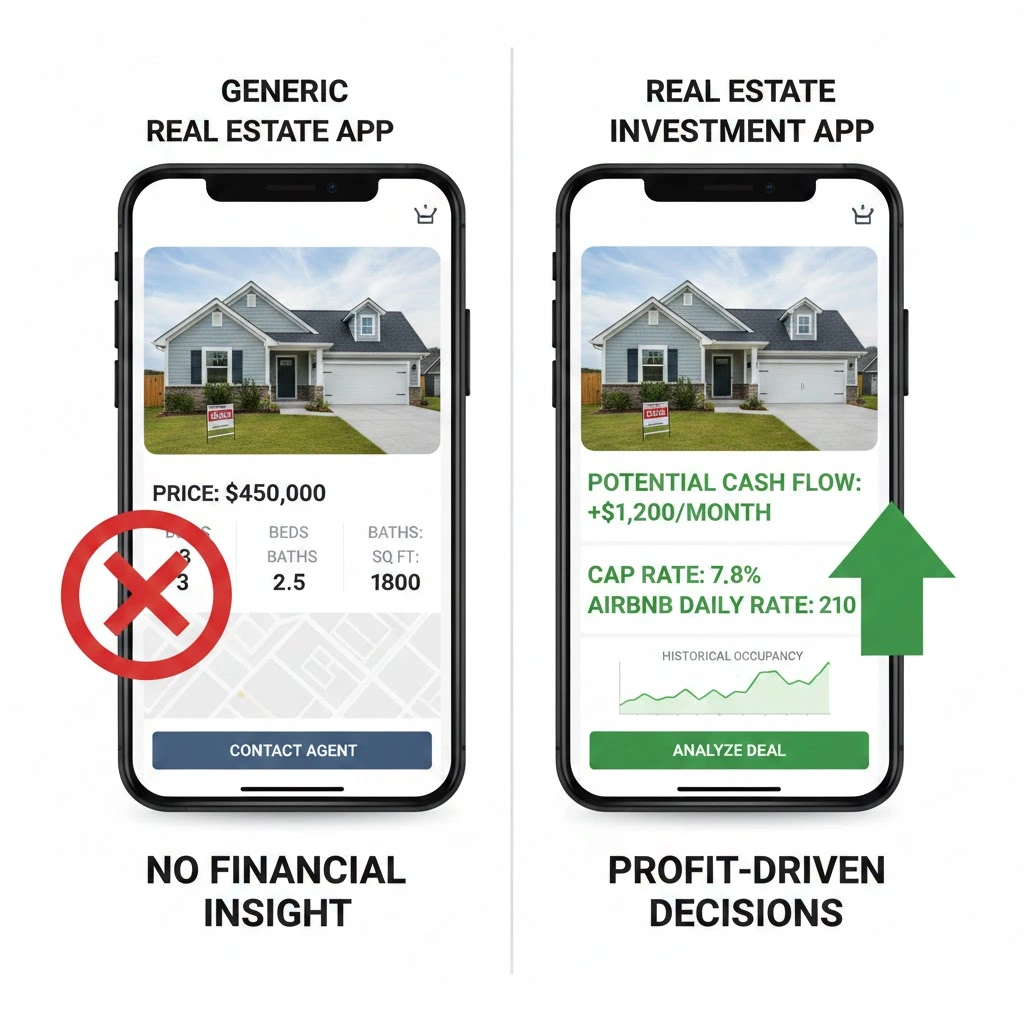
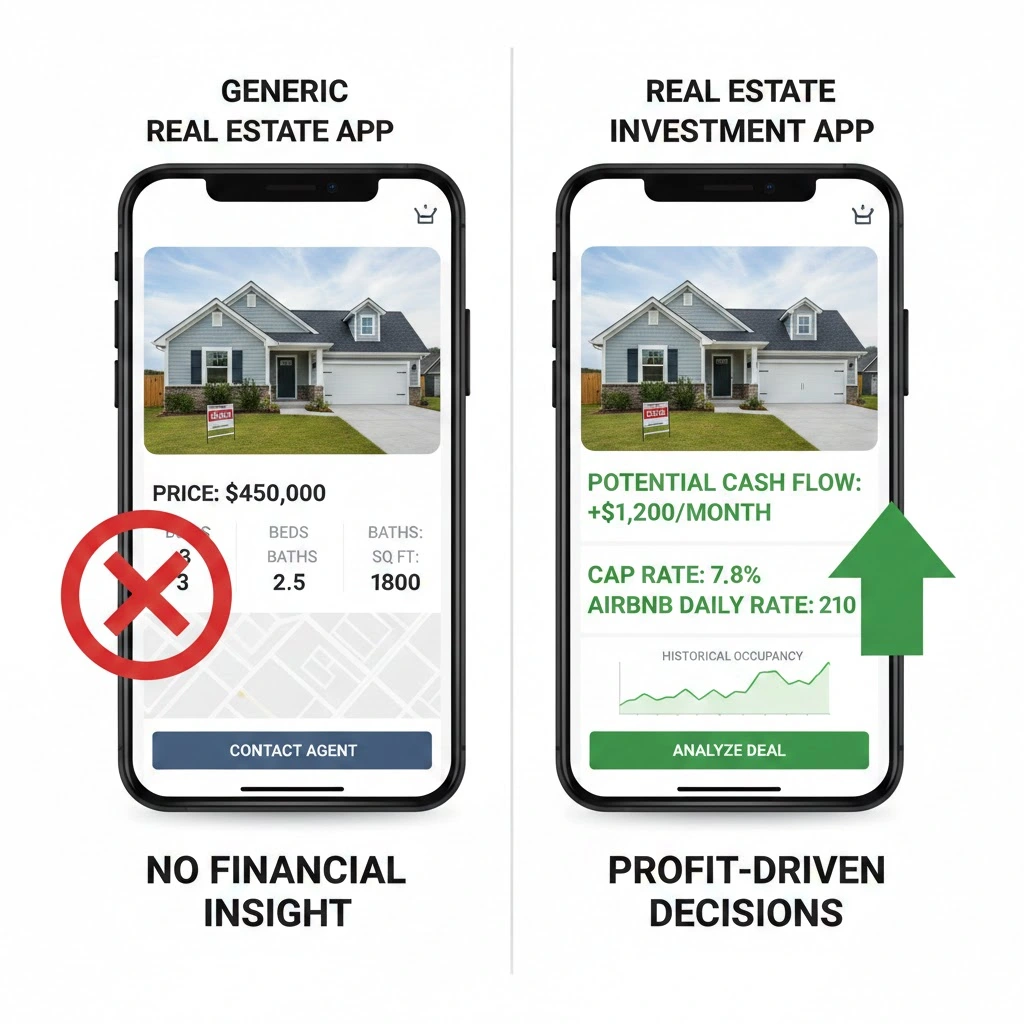
Instead, successful PropTech ventures are carving out their market share by focusing on financial intelligence. While a generic real estate app might present a three-bedroom house at a price point of $450,000, an investment-focused platform will offer a more nuanced view, potentially highlighting the same property with a 7.8% Cap Rate and an estimated $3,200 in monthly Airbnb potential. This shift in perspective is critical: the goal is no longer to help users find a house, but to empower them to underwrite an asset. This transforms the application’s backend from a passive display of information into an active tool for financial analysis.
The Core Feature Set for Investor Appeal
To build an application that resonates deeply with investors, developers must move beyond rudimentary search filters such as the number of bedrooms and bathrooms. The core features must directly address the most critical question for any investor: "Will this property generate a profit?"
ROI-Driven Search Capabilities
Investors do not typically search for properties based on school districts or neighborhood amenities; their primary criterion is yield. An effective investment app must incorporate filters that enable users to identify properties based on their financial performance. This includes the ability to sort and filter by metrics such as Cap Rate, Cash-on-Cash Return, and Projected Occupancy Rates. This approach fundamentally inverts the traditional search experience. Instead of starting with a desired location and hoping to find a suitable deal, users can begin with a profit objective and then identify the locations that best align with their financial goals.
Interactive Heatmaps for Visual Intelligence
The sheer volume of real estate data can be overwhelming for human comprehension. A list of hundreds of properties, for instance, is difficult to parse effectively. Visual intelligence offers a solution. The strategic implementation of heatmaps can visualize "investable corridors," allowing users to instantly identify neighborhoods offering the highest Airbnb revenue potential or the lowest price-to-rent ratios. This visual discovery layer often serves as a crucial entry point for user engagement.
The Deal Analyzer: A Retention Hook
The "Deal Analyzer" serves as a critical feature for user retention. Once a potential property is identified, investors need to perform detailed financial calculations. A dynamic calculator that allows users to toggle between traditional rental and Airbnb strategies, comparing their respective yields, is indispensable. The key to a superior analyzer lies in customization. Instead of relying on static defaults, users should be able to input their own mortgage rates, management fees, and down payment percentages to observe the impact on their projected Cash-on-Cash Return based on their unique financial situation.
The Data Ecosystem: Understanding the Stack
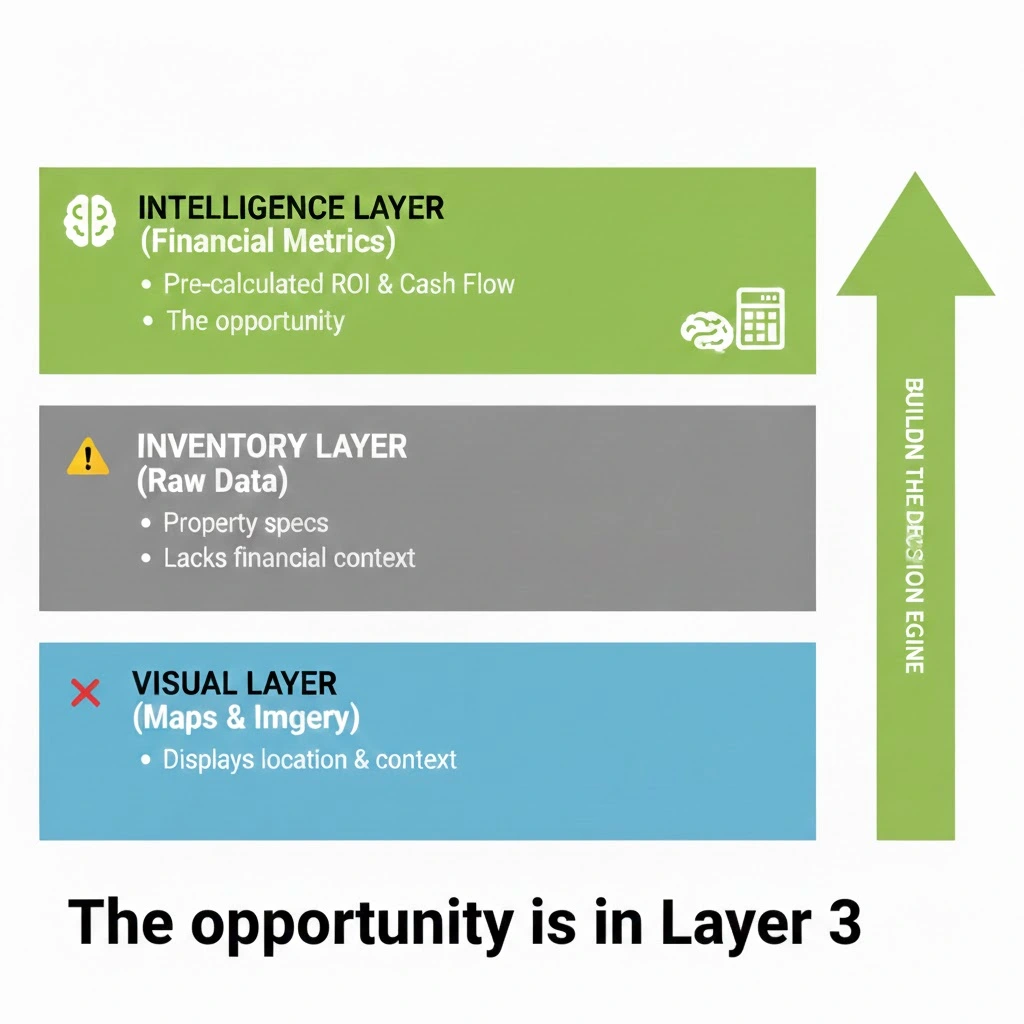
Before embarking on the technical development of a real estate investment app, a thorough understanding of the data landscape is paramount. Many founders mistakenly assume all real estate data is uniform, a critical error that can lead to significant development challenges. A modern real estate application is, in essence, a sophisticated stack comprising three distinct types of APIs.
Type A: The Visual Layer
These are foundational, often commoditized APIs, such as Google Maps or Mapbox. They are essential for displaying property locations and providing street-level views. However, they offer little insight into property value or investment potential. While they can indicate proximity to a park, they cannot quantify how that proximity might enhance rental yield.

Type B: The Inventory Layer
This layer provides the raw listing data, including property addresses, square footage, and list prices. While crucial, this data is inherently incomplete for investment purposes. It confirms a property’s existence but provides no information on its financial viability. Relying solely on this layer necessitates the establishment of extensive internal teams dedicated to data cleaning and normalization.
Type C: The Intelligence Layer
This is the often-missing link, the area where a significant majority of real estate apps falter. To build a true investment platform, access to pre-calculated financial metrics is essential. This includes data on rental comparables, expense ratios, and occupancy rates for individual properties. Constructing this dataset from scratch requires years of dedicated engineering effort. Many founders find themselves stuck at this stage, possessing mapping and listing data but lacking the critical investment logic.
The Master Architecture: A Top-to-Bottom View
To engineer a high-performance real estate investment engine, it is necessary to move beyond a simple client-server model. A production-ready architecture demands a three-tiered approach that meticulously separates raw data ingestion from proprietary investment logic. This structural design ensures that the application functions not merely as a data viewer but as a sophisticated financial analysis tool.
Tier 1: The Ingestion Tier (Data Sourcing)
This forms the foundational layer of the application’s stack. Rather than developing and maintaining fragile web scrapers, the ingestion tier should leverage pre-normalized data obtained through a robust API. This approach ensures data accuracy and reliability, bypassing the complexities of manual data acquisition.
Tier 2: The Logic Engine Tier (The Secret Sauce)
This constitutes the middle-layer service where proprietary value is added. Situated between the API and the user interface, this tier executes the "user-context overlay." It takes baseline API data and dynamically recalculates it based on user-specific inputs, such as financing terms or desired investment strategies.
Tier 3: The Presentation Tier (The User Interface)
The apex of the architectural stack is where the product vision is brought to life. This tier is responsible for delivering an intuitive and visually engaging user experience, presenting the analyzed data and financial insights in an easily digestible format.
The Request Lifecycle: From User Click to Financial Insight
To comprehend the intricate interplay between these architectural tiers in a live operational environment, consider the procedural execution flow of a single user session. This represents the sequential chain of events that transforms raw data into actionable financial insights:
- User Interaction: A user initiates an action within the application, such as searching for a property or adjusting an investment parameter.
- API Request: The frontend application formulates a request to the backend, specifying the user’s query or desired data.
- Data Ingestion: The Ingestion Tier receives the request and retrieves the necessary raw data from external APIs, including listing details and market benchmarks.
- Logic Engine Processing: The Logic Engine Tier receives the raw data. It then applies user-specific context (e.g., mortgage rates, down payment) to perform complex calculations, generating personalized investment metrics.
- Data Aggregation & Validation: The engine may also query supplementary APIs for comparative data or historical performance to validate its calculations and provide a comprehensive view.
- Response Formulation: The Logic Engine constructs a structured response containing the analyzed financial data, personalized insights, and relevant contextual information.
- Presentation Layer Rendering: The Presentation Tier receives the processed data and renders it in a user-friendly interface, displaying charts, graphs, and key financial indicators.
- User Insight Delivery: The user is presented with a clear, actionable financial analysis, enabling them to make informed investment decisions.
The Architecture Solution: Leveraging Infrastructure-Grade APIs
Historically, the primary barrier to entry for building sophisticated investment applications was the intricate data pipeline. This required a dedicated team of data engineers tasked with scraping websites, cleaning addresses, and merging duplicate records. Today, this entire hurdle can be circumvented by utilizing infrastructure-grade APIs that effectively manage the critical "Intelligence Layer."
To illustrate the construction of such an efficient architecture, the Mashvisor API can serve as a reference implementation. This API is selected because it uniquely integrates both the "Inventory Layer" and the "Intelligence Layer" out-of-the-box, providing essential pre-calculated investment metrics like Cap Rate and Cash-on-Cash Return. This integration streamlines the development process for the proposed architectural design.
Accelerating Development with Data APIs
A backend architecture meticulously divided into three distinct tiers of data ingestion is fundamental to creating an application that is both fast, accurate, and scalable.
Tier 1: The Market Benchmark Layer
Before a user even considers a specific property, they typically evaluate the broader market landscape. Building a backend system that aggregates thousands of individual listings to derive median values is computationally intensive and often slow. The architectural solution lies in targeting summary endpoints. Instead of performing local aggregations, the ingestion layer should query endpoints that provide normalized benchmarks, such as city-level investment data including average Airbnb Cap Rates, traditional rental income, and occupancy rates. This allows the frontend to render market health dashboards instantaneously, without placing undue strain on the application’s database.
This layer is particularly critical for the implementation of the interactive heatmap feature. By fetching city-level averages, neighborhoods can be color-coded based on their performance metrics, effectively guiding users towards the most profitable areas before they even engage with individual listings.
Tier 2: The Property Object and Financial Core
This tier represents the operational heart of the application. While a standard Multiple Listing Service (MLS) feed provides essential physical characteristics of a property, an investment-grade API delivers crucial financial performance data. The system should utilize an endpoint designed to retrieve property-specific financial intelligence. This acts as a universal entry point, enabling users to look up data by street address, Mashvisor ID, or MLS ID, ensuring flexibility regardless of how a deal is discovered.
By sending query parameters such as address, city, state, and zip code, the system triggers a request that returns far more than just a price. It yields a comprehensive breakdown object containing meticulously calculated cash flow, Cap Rate, and rental income projections for both Airbnb and traditional rental strategies, presented side-by-side. By ingesting this object, the investment logic engine begins with a fully completed underwriting model, rather than an incomplete dataset. This empowers developers to focus on building proprietary features, such as custom expense modeling, rather than expending resources on fundamental financial calculations.
For a developer, the distinction between "raw data" and "investment intelligence" is clearly discernible within the JSON response. Instead of mere physical specifications, the underwriting data is provided. This eliminates the risk of calculating these critical metrics incorrectly, which could erode user trust.
Tier 3: The Validation Layer
Trust in investment platforms is built upon verifiable data. Users will hesitate to accept ROI projections unless they can examine the comparable properties and aggregated data that underpin those figures. To construct a robust "Validation Layer," the application’s architecture must integrate two synchronized endpoints.
-
Macro: Aggregated Analysis
TheGET /v1.1/client/rento-calculator/lookupendpoint is instrumental in establishing the market baseline. This serves as the engine for high-level financial projections. Its dynamic functionality across multiple geographic levels—including city, neighborhood, zip code, or specific street address—allows the application to return pre-modeled financial metrics such as median rental income, occupancy rates, and Cap Rates in a single, efficient query. -
Micro: Dynamic Evidence
To ground these high-level projections in tangible reality, theGET/v1.1/client/rento-calculator/list-compsendpoint is layered in. This retrieves the actual Airbnb or Long-Term Rental (LTR) properties that were utilized in the preceding analytical steps.
The "Macro-to-Micro" Advantage cultivates a seamless trust loop by harmonizing high-level projections with granular, verifiable evidence. By leveraging these synchronized rento-calculator endpoints, developers can deliver dynamic, street-level validation through a unified data structure, thereby enhancing both investor confidence and engineering efficiency.
The Logic Engine: Moving Beyond the API
While APIs furnish the essential raw materials, the logic engine is the component that truly drives the application’s performance and value. The most critical element of a custom architecture is the investment logic engine itself. This is the proprietary code that distinguishes the platform from a mere data viewer.
A common pitfall for many founders is tightly coupling their frontend directly to the raw API response, displaying fields like airbnb_cash_flow directly to the user. This represents a missed opportunity to add significant value. A production-grade architecture treats the API response as a baseline scenario.
Implementing the User Context Overlay
The investment logic engine should ingest these baseline values and then apply a "user context overlay." This overlay incorporates user-specific inputs such as financing terms, tax bracket, and management preferences. For example, an API might return a Cap Rate calculated based on an all-cash purchase. The engine should then be capable of taking that Net Operating Income and dynamically calculating a Leveraged Internal Rate of Return (IRR) based on current mortgage rates. This necessitates a stateless calculation service positioned between the normalized data and the frontend.
The power of this logic engine becomes evident when considering a property in Florida with a baseline IRR of 11% based on an all-cash purchase. If a user then utilizes a financing toggle to apply a 25% down payment with a 6.8% mortgage rate, the engine should instantly recalculate that IRR to 17.4%, meticulously accounting for the new debt service. This immediate transformation from raw data to personalized insight is precisely why users are willing to pay for premium subscriptions.
This transformation constitutes the core of the software asset. The logic engine ingests the baseline "all-cash" data and outputs the "leveraged" reality, including personalized IRR, user context parameters, and monthly debt service. By building this logic layer, the application becomes insulated from fluctuations in API data sources. Should an API provider change its data structure, the proprietary algorithms for calculating IRR remain the intellectual property of the platform, ensuring long-term scalability and enhancing the valuation of the software asset itself.
Solving Seasonality with Historical Data
One of the most complex challenges in real estate technology development is accounting for seasonality. A simple snapshot of current rental income can be dangerously misleading. A property in a popular beach town, for instance, might show minimal revenue in November but generate $15,000 in July. If an application only ingests the performance data from the current month, it risks providing a wildly inaccurate underwriting model.
To address this, the architecture must implement a Time Series Analysis Layer. This layer interacts with historical performance endpoints to retrieve trend data over the preceding 12 to 36 months. When historical performance endpoints are queried, the system receives a dataset detailing monthly occupancy rates, average daily rates, and revenue figures. The architecture should not merely display this data as a chart; it should ingest this time-series data to compute a "Seasonality Index" for the property. By analyzing the variance in occupancy month-over-month, the system can assign a "Risk Score" to the asset. A property with consistent revenue exhibits low risk, while a property with high monthly fluctuations represents higher risk. Presenting this calculated risk score to users adds substantial value.
The Build vs. Buy Financial Argument
The decision to architect an application around an integrated API solution like Mashvisor’s is fundamentally a financial one. The alternative—building an in-house data engineering division—represents a significant financial commitment, easily exceeding $150,000 annually in engineering salaries and infrastructure costs alone.
To effectively illustrate the trade-off between internal development overhead and speed-to-market, a comparative analysis can be presented:
| Feature | Build Internal | Integrate API |
|---|---|---|
| Time to Market | 6-12 months | 2-4 weeks |
| Engineering | Dedicated Data Team Required | Existing Backend Team |
| Maintenance | Constant Scraper Updates | Managed Endpoints |
| Legal/Risk | High Legal Risk (Scraping) | Fully Licensed Data |
| Pricing | High/Unpredictable Capital Expenditure (CAPEX) | Fixed/Scalable Operational Expenditure (OPEX) |
By adopting a "Buy" mindset for data infrastructure, real estate data is treated as a utility. This strategic shift allows development teams to concentrate their efforts on higher-value activities, such as:
- Developing proprietary features that create competitive advantages.
- Enhancing the user experience and interface design.
- Implementing sophisticated investment logic and analytics.
- Scaling the business and acquiring new customers.
Monetizing the Intelligence Layer: Selling Insight over Information
Generic real estate applications often struggle with effective monetization strategies because property search has become a commoditized service. Investment-focused platforms, however, possess powerful revenue levers because they sell "financial certainty." The monetization strategy should directly mirror the application’s data architecture.
The Pro Subscription: Gating the Intelligence Layer
The most effective monetization model is a value-based paywall. The visual and inventory layers of the application can be utilized to drive top-of-funnel engagement and encourage user sign-ups. Once a user attempts to access the "intelligence layer"—the pre-calculated Cap Rates, Cash-on-Cash Returns, and the logic-engine-driven calculators—they are prompted to upgrade to a "Pro Tier." By gating the financially intelligent data objects, revenue is directly tied to the highest-value data points within the application’s stack.
The Enterprise Tier: The Validation and Risk Premium
For institutional investors or high-volume buyers, achieving trust requires demonstrable evidence. The "validation layer" can be monetized separately. This tier provides access to:
- Detailed comparative market analysis (CMA) reports.
- Property-specific historical performance data.
- Aggregated neighborhood performance metrics.
- Customizable risk assessment reports.
The High-Intent Lead Generation Model
Instead of selling generic leads to any real estate agent, platforms can route "Investment-Ready" leads. A user who has spent considerable time adjusting mortgage rate sliders within the logic engine, indicating specific ROI thresholds they are targeting, represents a high-intent buyer. By tagging users based on their specific investment criteria, platforms can connect them with investment-savvy realtors or lenders who are willing to pay a premium for qualified, data-driven prospects.
Conclusion
The current opportunity within the PropTech sector lies not in sheer volume, but in demonstrable value. By transitioning from a generic search portal to a specialized investment platform, entrepreneurs can address a more complex problem for a more lucrative audience. With an appropriate architecture anchored by robust data APIs, such as Mashvisor’s, it is possible to develop a product that transcends merely showing users a house; it can illuminate their potential financial future. Technology is no longer the primary barrier. The tools exist to build these sophisticated applications in months rather than years. The remaining and most significant challenge is execution.
Ready to build the next generation of PropTech?
Don’t let data fragmentation hinder your launch timeline. Join the growing number of founders and developers leveraging Mashvisor’s infrastructure-grade API to power their sophisticated investment engines. Book a brief introductory call to map out your ideal architecture and data stack.

