

The execution of a complex structural modification within a residential property built in 1991 has highlighted the intricate balance between architectural modernization and disciplined fiscal management. The project, centered on the removal of a load-bearing wall that previously bifurcated the primary living and dining areas, represents a significant investment in both residential utility and property value. This technical overhaul was accompanied by a rigorous monthly financial audit, revealing a total expenditure of $5,044.63 for the period of June, a figure that underscores the costs associated with high-level home improvement and essential living expenses.
Structural Overhaul: The Removal of a Load-Bearing Partition
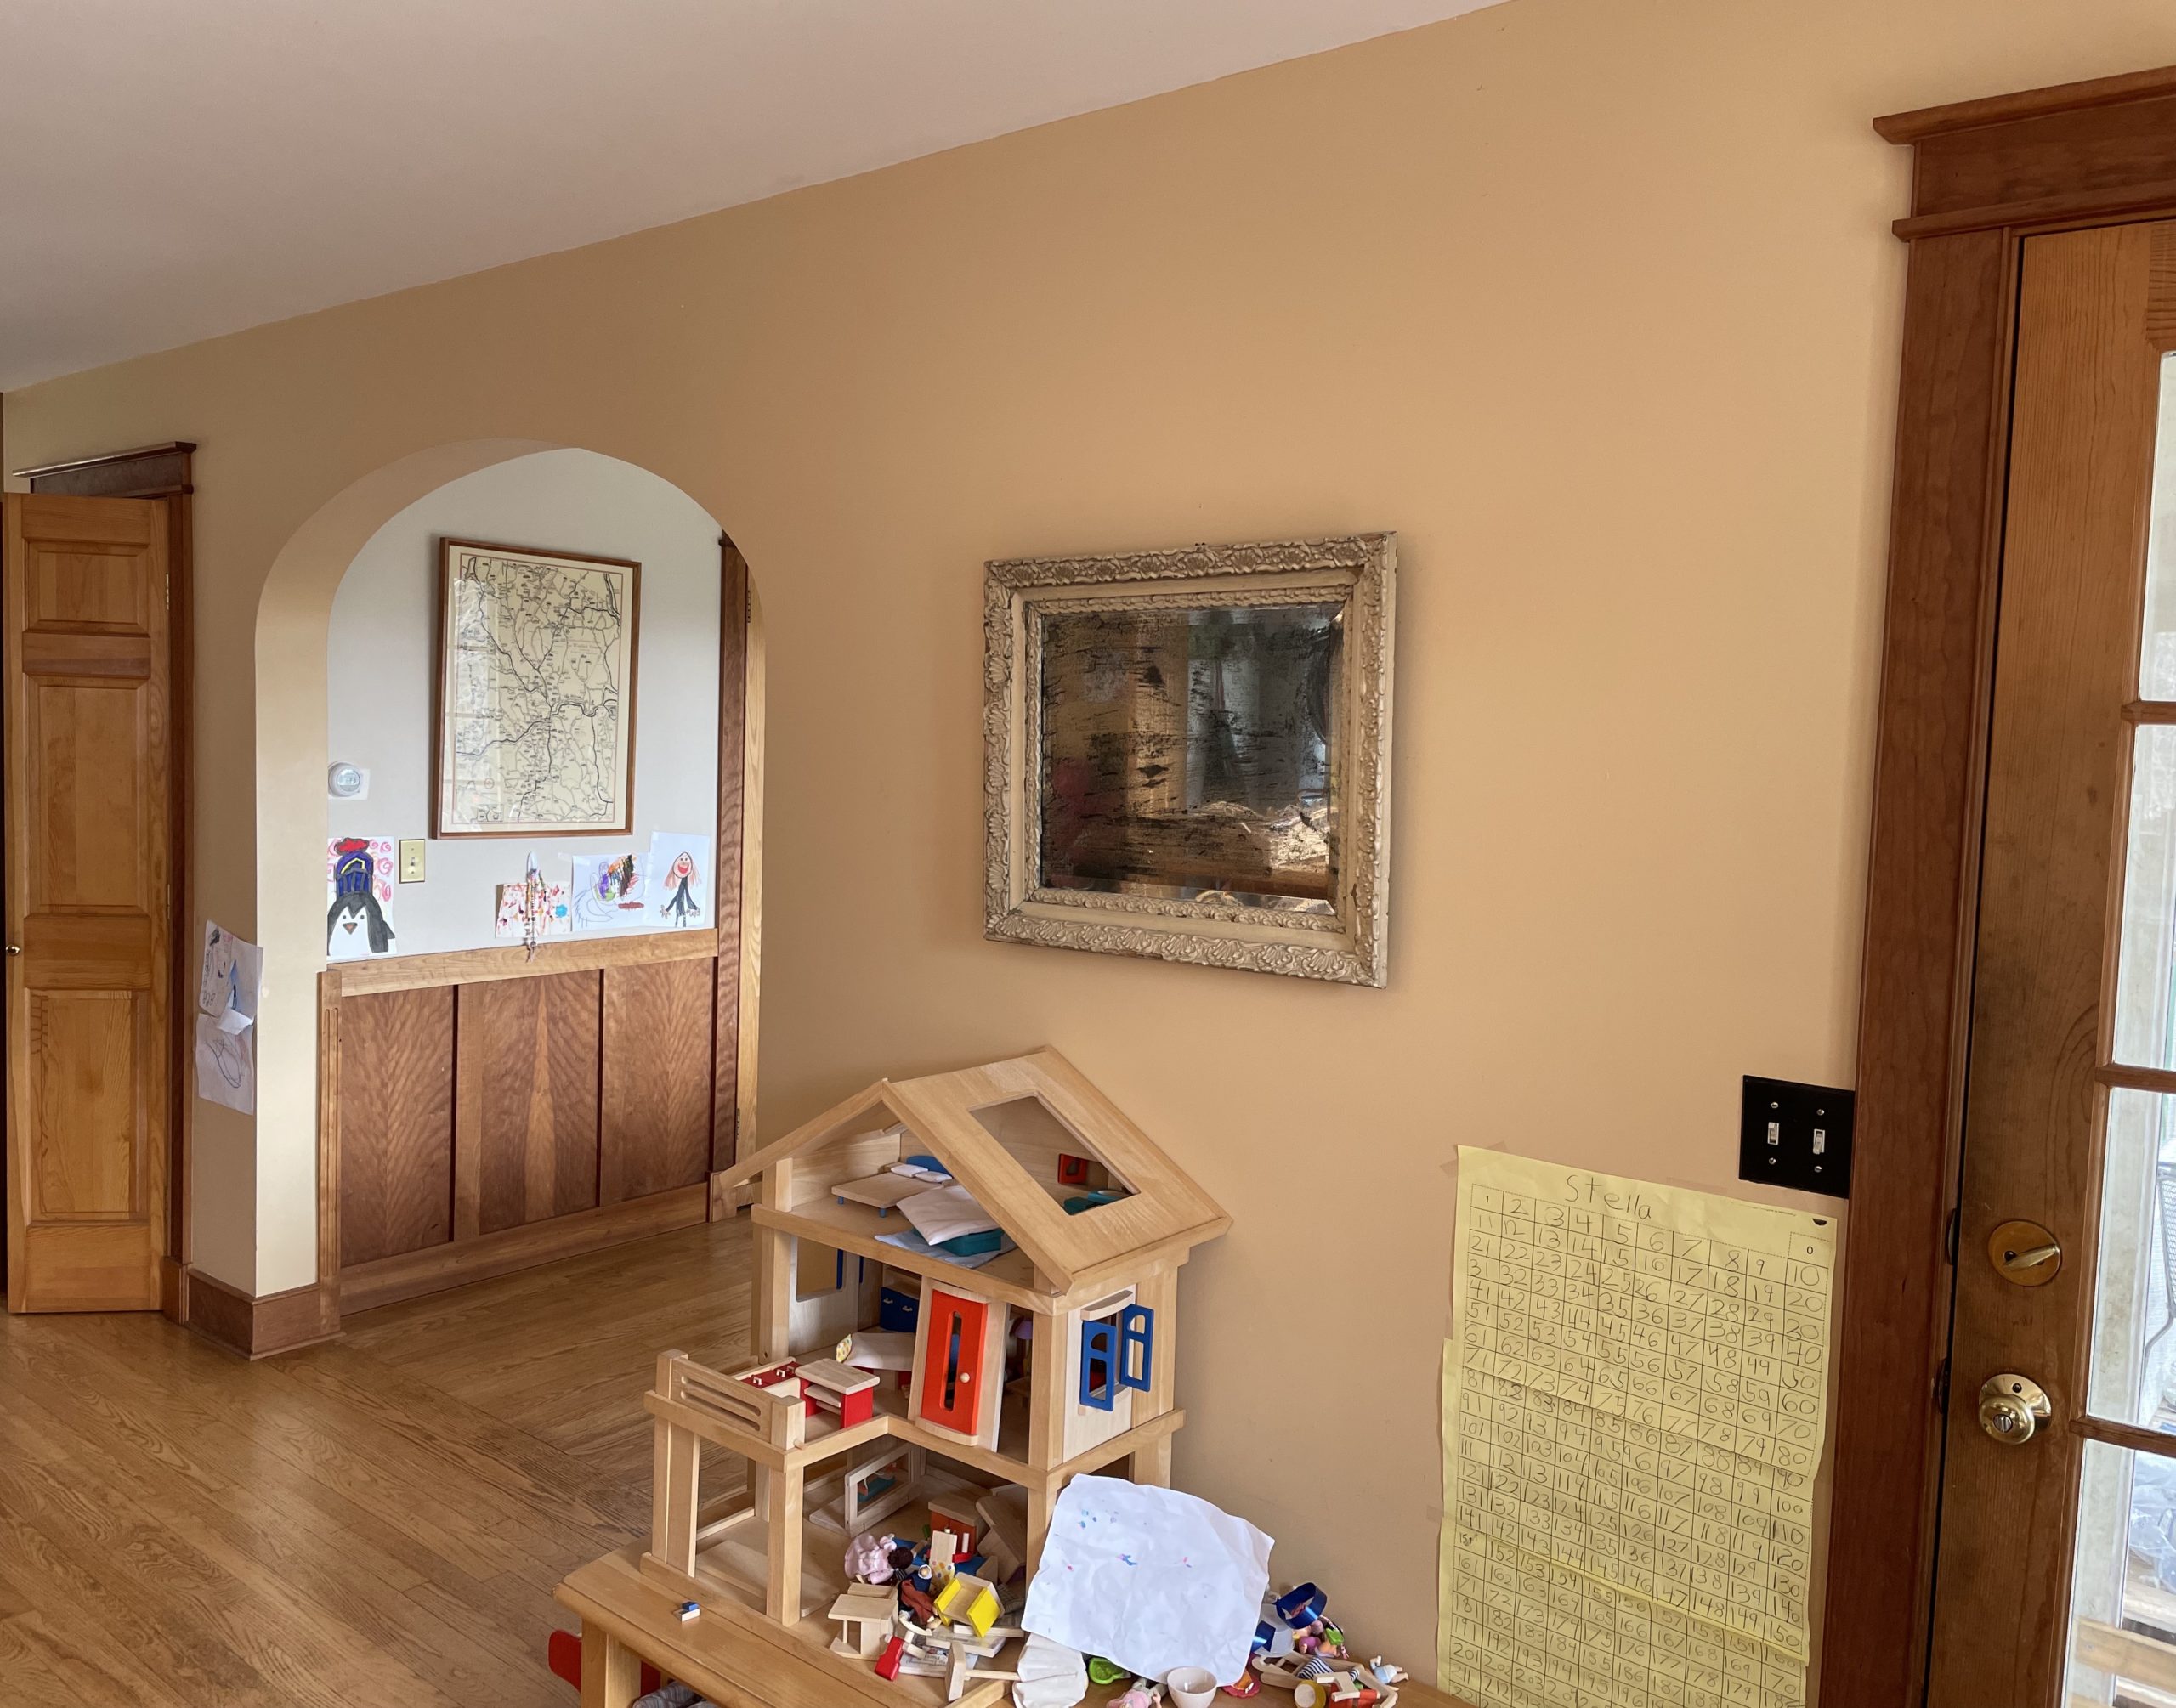
The focal point of the recent renovation was the demolition of a structural wall that had historically served as a utility hub for the residence. In many homes constructed during the late 20th century, central walls were utilized not only for load distribution but also as conduits for essential mechanical systems. This specific partition, characterized by an aesthetically dated low archway, significantly impeded the "flow" and natural light distribution between the kitchen, dining room, and living area.
Technical assessments prior to demolition identified three critical systems housed within the wall:

- A primary plumbing stack servicing the upper levels.
- Centralized HVAC ducting responsible for climate control.
- The primary electrical distribution box and associated wiring for the ground floor.
The complexity of these integrated systems classified the removal as a high-difficulty undertaking, requiring a hybrid approach of skilled labor and professional consultation. While the homeowners performed the initial demolition and carpentry, the rerouting of the plumbing stack required a professional plumber to execute a complex "zig-zag" configuration through the ceiling joists. Similarly, a licensed electrician was engaged to relocate the electrical hub and install new recessed lighting, addressing a chronic lack of overhead illumination in the living area.
Engineering and Chronology of the Renovation
The project followed a strict engineering timeline to ensure structural integrity was maintained throughout the transition. Because the wall was load-bearing, the homeowners could not simply remove the studs without risking a catastrophic ceiling failure.
The sequence of events was as follows:
- Initial Demolition: Removal of drywall and non-structural elements to expose the internal framing and utility lines.
- Architectural Calculation: An architect was retained to perform load calculations, determining the specific dimensions and material requirements for a replacement support beam.
- Utility Rerouting: Professional trades handled the relocation of the plumbing stack and electrical box, ensuring all modifications met current building codes.
- Temporary Support Installation: A temporary structural wall was constructed to support the upper floor’s weight during the transition period.
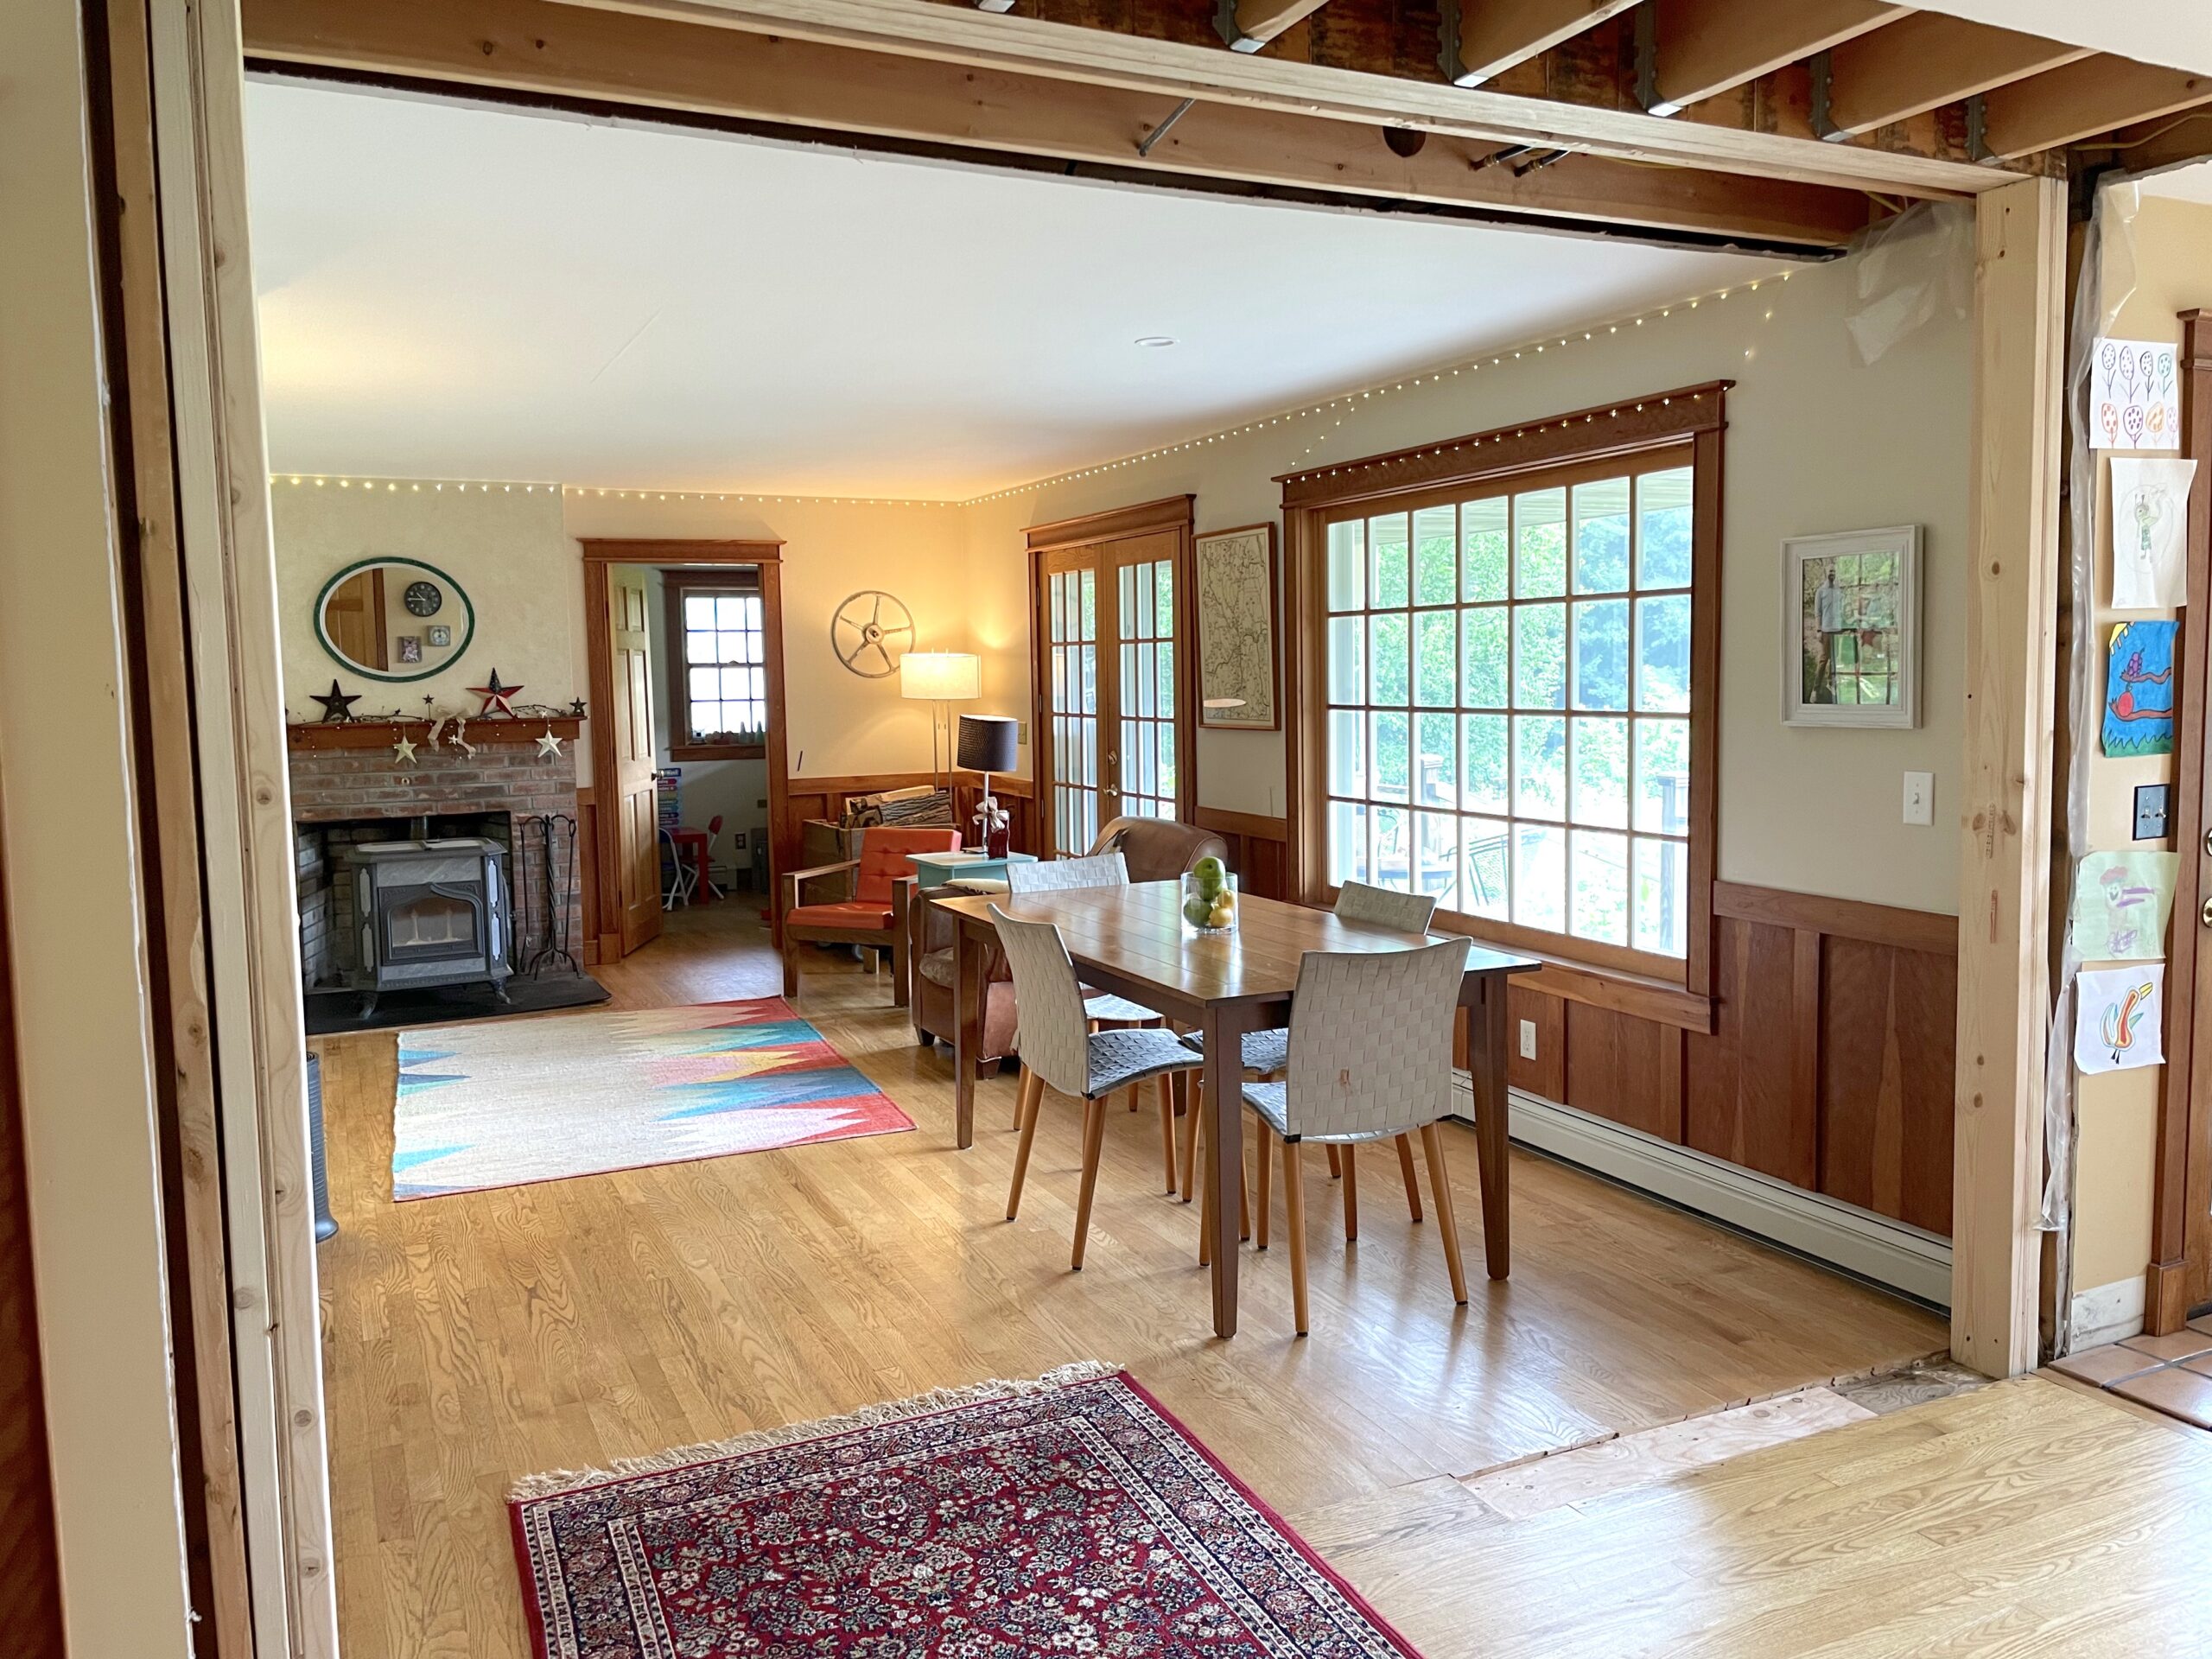
- Beam Integration: A recessed support beam was installed within the ceiling joists. This "invisible" structural solution allows for a flush ceiling finish, eliminating the need for a dropped header and maximizing the sense of open space.
- Finishing Phases: The project is currently entering the final stages of drywalling and flooring integration, with plans to coordinate further electrical upgrades during the kitchen’s upcoming modernization phase.
Financial Performance and Resource Allocation
The total expenditure for June reached $5,044.63, a figure driven largely by the intersection of the renovation costs and rising commodity prices. A detailed analysis of the budget reveals that home improvement materials and professional labor accounted for a significant portion of the month’s outlays.
Home Improvement Expenditures
The financial data indicates that $1,304.14 was spent on raw materials, including lumber, drywall, and specialized tools such as a bottle jack and heavy-duty fasteners. An additional $494.98 was allocated to professional electrical services. These figures do not include the cost of the structural architect or the plumber, which were likely accounted for in previous fiscal cycles or as separate line items.
Cost of Living and Commodity Trends
Groceries remained the largest non-project expense at $1,147.44. This reflects broader national trends in food inflation, though the homeowners mitigate some costs through bulk purchasing, such as a 50lb order of organic oats totaling $134.48. Transportation costs, including fuel and vehicle inspections, totaled approximately $254.35, while utility costs remained low due to the integration of solar technology. The monthly electric bill was reported at a base rate of $36.42 for grid maintenance, demonstrating the long-term ROI of renewable energy investments.
Strategic Financial Management and Optimization
Beyond the physical renovation, the June fiscal report highlights a sophisticated approach to capital management, utilizing high-yield accounts and specialized service providers to maximize liquid assets.
High-Yield Savings and Interest Accumulation
The homeowners advocate for the use of High-Yield Savings Accounts (HYSA) as a primary tool for capital preservation. With interest rates for accounts like American Express Personal Savings hovering around 4%, a $5,000 balance can generate $200 in annual passive income. This strategy stands in stark contrast to traditional low-interest savings accounts, which offer negligible returns and fail to hedge against inflation.

Mobile Virtual Network Operators (MVNOs)
A notable efficiency in the monthly budget is the $28.24 expenditure for two cellular phone lines. This was achieved through the use of an MVNO, a service provider that leases bandwidth from major carriers (such as Verizon or T-Mobile) and resells it at a reduced rate. By avoiding the overhead of "Big Three" providers, the homeowners reduced their communication costs to approximately $14.12 per person, a significant decrease from the national average of $70 to $100 per line.
Credit Strategy and Cash-Back Incentives
The financial report also details a "spend-to-earn" strategy using cash-back rewards. By channeling $4,445.10 of necessary spending through a Fidelity Rewards Visa, the household earned $88.90 in cash back (2% flat rate). This systematic use of credit for all purchases—provided the balance is paid in full monthly to avoid interest—serves as a friction-less revenue stream.
Broader Impact and Market Implications
The successful removal of the load-bearing wall and the subsequent opening of the floor plan are expected to have a positive impact on the property’s market valuation. Modern residential real estate trends heavily favor "open-concept" designs, which improve the perceived square footage and functionality of a home. By performing the carpentry and demolition in-house while outsourcing technical engineering and code-sensitive tasks, the homeowners effectively maximized their sweat equity.
Furthermore, the transparency of the June expense report provides a case study in "frugal-professionalism." It demonstrates that high-quality residential outcomes do not require unlimited budgets, but rather strategic allocation of funds, a willingness to learn advanced DIY skills, and the disciplined use of financial tools.
Conclusion and Future Outlook
The June renovation marks a pivotal milestone in a multi-year plan to modernize a 1990s-era residence. The transition from a compartmentalized layout to an open, light-filled space addresses both aesthetic and structural deficiencies. Moving forward, the household plans to leverage the current open-ceiling state to finalize kitchen electrical upgrades, a move that exemplifies proactive project management designed to minimize future disruption.
As the property enters the final finishing phases, the financial focus will likely shift back toward capital accumulation and long-term investment. The integration of high-yield savings, solar energy, and low-cost service providers continues to provide a stable foundation for major capital projects, proving that meticulous financial tracking is the essential counterpart to successful residential engineering.
Summary of June Expenditures
| Category | Amount | Key Components |
|---|---|---|
| Groceries | $1,147.44 | Standard provisions and bulk grains |
| Home Improvement | $1,304.14 | Lumber, drywall, and structural tools |
| Professional Labor | $494.98 | Electrical rerouting and lighting |
| Healthcare | $292.12 | Insurance premiums and lab co-pays |
| Transportation | $254.35 | Fuel and annual vehicle inspection |
| Utilities | $108.42 | Solar-tied electric and internet |
| Other | $1,443.18 | Restaurants, household supplies, and apparel |
| Total | $5,044.63 |