
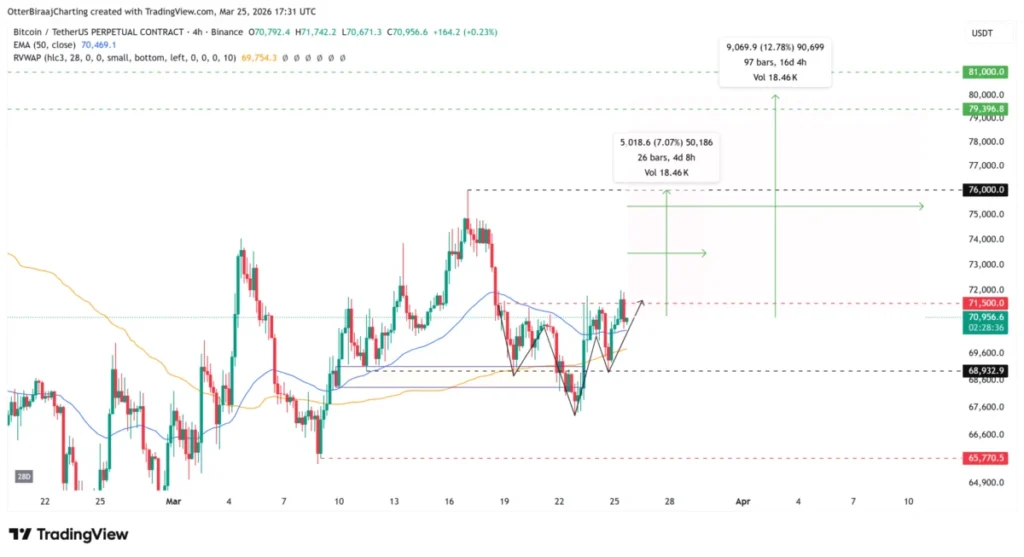
Bitcoin (BTC) is currently engaged in a critical test of the $71,500 pivot level, a significant threshold recognized across multiple trading timeframes. Analysts are observing price action that suggests a potential rally towards the $80,000 mark, though market dynamics remain complex, characterized by a dichotomy between futures-driven speculation and more subdued spot demand. Over the past seven days, Bitcoin has approached this crucial inflection point on four separate occasions, underscoring its importance in the current market landscape. While the cryptocurrency has managed to maintain its position above the 50-period exponential moving average (EMA) on the four-hour chart, a positive indicator for short-term momentum, the 50-day EMA on the daily chart continues to present a formidable level of resistance, signaling a need for sustained buying pressure to overcome this hurdle.
The current market environment, where Bitcoin hovers around the $71,500 mark, has been described by prominent crypto trader Skew as a "compression zone." This signifies a period of tightening price ranges and trading activity, which typically precedes a significant directional move. The anticipation of such a move is further bolstered by technical chart patterns. On the four-hour chart, a bullish inverse head and shoulders pattern is in formation, with the $71,500 level acting as its neckline. A confirmed breakout above this neckline would unlock immediate technical targets, with a projection towards monthly highs near $76,000, representing a potential gain of 7.35% from current levels. Market analyst Mikybull has further extended this bullish outlook, suggesting that $80,000 could be Bitcoin’s next significant destination should the upward momentum persist.
On-Chain Signals Point to Potential Rally
Beyond technical indicators, on-chain data is also providing signals that could support a rally. A notable on-chain signal indicates the possibility of a 10% to 14% Bitcoin rally. Specifically, the seven-day standard deviation of short-term holder realized profit and loss flows to Binance has recently declined to 255, as of March 24. This level is significant because it mirrors periods observed prior to substantial previous rallies. For instance, a similar reading near 277 on February 27 was followed by a 14% surge in Bitcoin’s price. Earlier, in late December, a reading around 289 preceded a near 10% gain. The current compression in this metric suggests a decline in sell-side volatility, indicating that short-term holders are exhibiting more controlled distribution of their holdings. This easing of selling pressure from a segment of the market that has historically been more prone to panic selling can create a more favorable environment for price appreciation.

The realized profit and loss data for short-term holders (STHs) provides insight into the behavior of investors who have held BTC for less than 155 days. When this metric shows a decline in volatility and a stabilization of profit-taking or loss-realization, it suggests that these more active traders are either holding onto their positions with conviction or are being more strategic in their entries and exits. This reduced "noise" from STHs can allow for clearer price discovery and potentially facilitate a sustained upward trend, especially when combined with other bullish technical and fundamental factors. The drop to 255 on the seven-day standard deviation implies a less frenzied selling environment, which is a prerequisite for any significant price increase.
Geopolitical Developments and Market Reactions
Recent price strength in Bitcoin has been partially attributed to market optimism surrounding potential ceasefire developments in the US and the ongoing conflict between Israel and Iran. However, this sentiment faced a setback on Wednesday when Iran reportedly rejected a US peace proposal and outlined its own conditions for ending the conflict, according to The Kobeissi Letter. Despite this geopolitical development, Bitcoin demonstrated resilience, holding steady through the update. This suggests that while broader geopolitical tensions can influence market sentiment, the cryptocurrency’s price action is increasingly being guided by other factors, including the strength of the US dollar and global energy prices, which continue to dictate short-term reactions.
The conflict in the Middle East, while a significant geopolitical event, has had a complex and somewhat contradictory impact on Bitcoin’s narrative. Initially, there were expectations that Bitcoin might act as a digital safe haven, similar to gold, in times of geopolitical uncertainty. However, its price movements have often mirrored those of risk assets, reacting more to global economic sentiment and investor risk appetite than to direct geopolitical hedging. The market’s ability to absorb the news of Iran’s rejection of the peace proposal without a significant downturn indicates a growing decoupling from immediate geopolitical anxieties, or perhaps a pricing-in of such risks.
Derivatives Markets Show Heightened Activity
The derivatives market for Bitcoin is exhibiting increased activity, signaling a rise in speculative interest. Bitcoin’s open interest, measured in USD, has seen a substantial increase of $500 million over the past 24 hours, reaching $16.5 billion. Furthermore, funding rates have turned positive, hovering around 0.03% since Monday. This positive funding rate suggests that traders holding long positions are paying a premium to those holding short positions, indicating a prevailing bullish sentiment in the futures market. The recent rally towards the $70,000 mark was largely propelled by activity in these futures markets, highlighting their influence on price discovery.

The surge in open interest indicates that more capital is flowing into Bitcoin derivatives, either through new positions being opened or existing ones being rolled over. This can amplify both upward and downward price movements. The positive funding rates are a crucial indicator of sentiment in perpetual futures markets, where traders perpetually roll over their positions. When funding rates are positive, it means longs are paying shorts, which is typically associated with a bullish outlook, as traders expect the price to continue rising. This speculative fervor, driven by futures markets, is a key component of the current price action, though it also introduces an element of volatility.
Spot Demand Remains a Crucial Factor
Despite the bullish signals from the derivatives market, spot participation in Bitcoin trading appears to be lagging. The aggregate cumulative volume delta (CVD) on spot exchanges is showing a weak negative figure of -$87 million, and the Coinbase premium remains negative. A negative Coinbase premium, which reflects the difference between the BTC price on Coinbase and its price on other exchanges, typically signals softening demand from US-based traders. This disparity between futures market enthusiasm and weaker spot demand suggests a mixed order flow.
The cumulative volume delta (CVD) is a technical indicator that measures the cumulative difference between volume on up-closes and volume on down-closes. A negative CVD suggests that more selling pressure has been absorbed during down moves than buying pressure during up moves, indicating potential weakness in immediate buying interest. The negative Coinbase premium is particularly noteworthy as Coinbase is a major US-based exchange. A sustained negative premium can imply that institutional or retail buyers in the US are not as aggressive as those in other markets, or that there is a greater supply available on US exchanges relative to demand. This divergence between futures and spot markets is a critical point of analysis for traders and investors.
Analyst Perspectives on Sustained Breakout
Market analysts are emphasizing that for Bitcoin to sustain a breakout above the crucial $71,500 level, the rally needs to be underpinned by stronger, more consistent underlying demand. Skew further elaborated on this point, stating that a sustained upward move requires robust buyer support, steady accumulation by investors, and the continued absorption of selling pressure from short traders. The ability of the market to absorb selling pressure, particularly from short sellers who might be trying to profit from a price decline, is a testament to the underlying strength of buying interest.

The recent filling of a $60 million Bitcoin bid during the New York session provides a glimmer of renewed demand. This significant order being executed suggests that substantial buyers are actively looking to enter the market at current price levels. However, for the price to solidify a bullish structure above $71,500 and maintain upward momentum, a clear and sustained follow-through of such buying interest is essential. Without this consistent demand, the current price level could become a point of resistance, leading to a consolidation or even a reversal if selling pressure intensifies.
Broader Market Context and Investor Behavior
The behavior of Bitcoin holders, particularly short-term holders, has been a subject of recent analysis. Reports indicate a shift from panic-driven selling to a more disciplined approach of holding a cash buffer as market volatility deepens. This suggests an evolution in investor psychology, where recent market participants are becoming more strategic and less reactive to short-term price fluctuations. This maturation of the investor base can contribute to greater market stability and provide a more solid foundation for sustainable price increases.
The ability of Bitcoin to rebound and hold its ground during periods of heightened geopolitical tension, such as the recent Iran-related events, has been a topic of discussion. While it has shown resilience, its role as a traditional safe-haven asset remains unproven. Its correlation with broader risk assets suggests that its primary function in the current market is more aligned with speculative investment driven by macroeconomic factors and technological adoption rather than acting as a hedge against geopolitical instability.
Conclusion: A Critical Juncture for Bitcoin
Bitcoin stands at a critical juncture, with the $71,500 pivot level serving as a key determinant of its short-to-medium term trajectory. The confluence of bullish technical patterns, such as the inverse head and shoulders formation, and supportive on-chain signals suggests the potential for an upward move towards $80,000. However, the market’s resolve is being tested by a divergence between speculative fervor in the derivatives market and more cautious demand in the spot market. The sustained strength of buying interest, particularly from US-based participants, and the ability of the market to absorb selling pressure will be crucial in determining whether Bitcoin can cement its position above this pivotal resistance level and embark on its next significant rally. Investors and traders will be closely monitoring order flow data, on-chain metrics, and macroeconomic developments for further clues on Bitcoin’s path forward.