
A notable Bitcoin (BTC) bottoming signal, which presaged a remarkable 130% rally in 2024, has re-emerged this week, reigniting discussions about a potential bullish inflection point for the cryptocurrency. However, the current market landscape, shaped by evolving liquidity conditions, the impact of Exchange-Traded Funds (ETFs), and macroeconomic shifts, presents a distinct environment compared to two years ago, suggesting that the path forward may not be a simple replication of the previous cycle’s trajectory.
The "Extreme High Risk" Zone: A Familiar Harbinger?
Data aggregator Swissblock has highlighted that Bitcoin has now spent an unprecedented 25 consecutive days within its "extreme high risk" zone. This duration surpasses the previous record of 23 days observed in 2023, a period that ultimately led to a significant price surge. Historically, prolonged stays in this high-risk territory have often coincided with the latter stages of a price drawdown or served as a precursor to a market bottom. The "extreme high risk" zone, as defined by indicators like Swissblock’s Bitcoin Risk Index, typically suggests that market sentiment is highly bearish, leading to capitulation selling that can eventually exhaust sellers and pave the way for a reversal. The current extended period in this zone, while historically significant, has yet to be followed by a strong, sustained upward momentum, a deviation from the pattern observed in 2023.
Further lending credence to the potential for a bottoming phase, Michaël van de Poppe, founder of MN Capital, pointed to the interplay between Bitcoin’s price and its supply in profit and loss charts. This analysis reveals that BTC is currently interacting with levels that have historically marked significant bottoming phases. In 2023, the transition from this high-risk state to a lower-risk environment was a key catalyst for the powerful bullish expansion that followed. The current chart patterns, showing Bitcoin touching these historically significant support levels, are being closely watched by analysts as a potential indicator of a similar turning point.

However, the sentiment among traders and the underlying demand metrics offer a more nuanced picture. RugaResearch noted that the 30-day apparent demand for Bitcoin has been volatile, oscillating between positive and negative territory. While selling pressure appears to have abated, sustained and dominant buying demand has not yet solidified. This suggests that while the immediate pressure to sell may be easing, the conviction to buy and drive prices higher is still developing. This divergence between a potential technical bottoming signal and the current state of trader positioning underscores the complex dynamics at play.
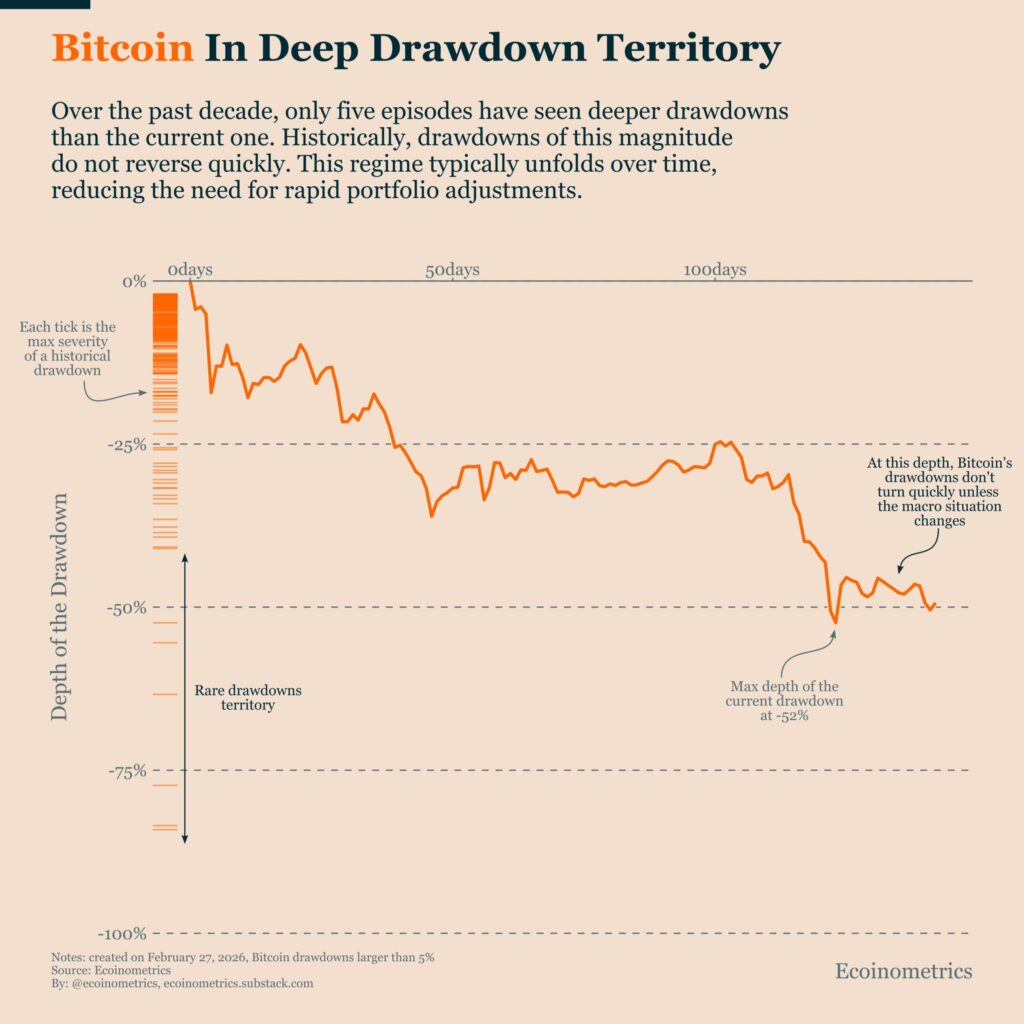
The Lingering Shadow of Drawdowns and Shifting Capital Flows
The historical context of Bitcoin drawdowns provides a sobering perspective on the potential recovery timeline. Macroeconomic newsletter Ecoinometrics observed that significant Bitcoin declines, such as the current one, rarely resolve themselves swiftly. With the notable exception of the March 2020 COVID-19 crash, which was amplified and rapidly reversed by aggressive monetary policy interventions, recoveries from 50% drawdowns have typically been protracted affairs, unfolding over extended periods. This suggests that even if a bottom has been formed, a substantial rally may take time to materialize.
The influx of capital into different asset classes also paints a picture of evolving investor preferences. Data compiled by Bold.report reveals a significant shift in capital allocation, with cumulative inflows into gold ETFs surpassing spot Bitcoin ETF flows on a 90-day rolling basis since August. This trend is particularly noteworthy given the increasing accessibility and institutional adoption of Bitcoin ETFs. Moreover, Bitcoin funds themselves have experienced negative flows on a 90-day average rolling basis, currently standing at approximately -$2.06 billion. This indicates that, in aggregate, more capital has been withdrawn from Bitcoin ETFs than has been invested in them over this period, a stark contrast to the initial euphoria surrounding their approval. This preference for gold, often seen as a safe-haven asset, over Bitcoin suggests a cautious sentiment among investors, who may be prioritizing capital preservation in the face of economic uncertainties.
Macroeconomic Headwinds and Liquidity Constraints
The prevailing macroeconomic environment adds another layer of complexity. Ecoinometrics highlighted that the headline Personal Consumption Expenditures (PCE) index, a key inflation gauge closely monitored by the Federal Reserve, remains elevated, hovering near 2.9% year-on-year. Core PCE is also near 3.0%, and core services inflation is above 3.4%. The Federal Reserve’s target for PCE is 2%, and the recent trend has not demonstrated a clear and consistent downward trajectory towards this goal. This persistent inflation, coupled with the Fed’s current stance, suggests that significant interest rate cuts, which would typically inject liquidity into the financial system and boost risk assets like Bitcoin, are unlikely in the immediate future. Limited expectations for liquidity expansion create headwinds for a rapid and sustained bullish surge in Bitcoin.

The broader market regime, as described by Willy Woo, Managing Partner at CMCC Crest, is heavily bearish, characterized by deteriorating liquidity in both spot and futures markets. Woo posits that any short-term relief rallies, potentially reaching the $70,000 to $80,000 range, are likely to encounter renewed selling pressure due to this overarching bearish sentiment and strained liquidity conditions. This suggests that even if technical indicators flash bullish signals, the underlying market structure may not be robust enough to support a sustained upward move without addressing these liquidity concerns and broader economic uncertainties.
Woo further delineates key price levels that frame the current debate. He identifies the $45,000 level as aligning with previous bear market lows, a crucial point of reference. Below this, he highlights $30,000 and $16,000 as historical support zones that are critical for the preservation of longer-term bullish trends. These levels serve as significant psychological and technical barriers, and a sustained break below them could signal a deeper and more prolonged downturn, while holding them could provide a foundation for a future recovery.
Contrasting Market Narratives: 2023 vs. 2024
The Bitcoin market in 2023, when the previous bottom signal emerged, was characterized by a different set of circumstances. The cryptocurrency was recovering from a prolonged bear market following the 2021 highs. Institutional interest was growing, but the landscape of ETF products was nascent. The macroeconomic environment, while also facing inflationary pressures, was not as dominated by the same persistent concerns about interest rate policy as it is today. The anticipation of the halving event also played a significant role in driving sentiment.
In contrast, the current market in 2024 is operating under the shadow of the post-halving period, with the immediate euphoria having subsided. The advent of spot Bitcoin ETFs in the United States has brought a new wave of institutional participation, but as evidenced by the flow data, this has not translated into consistent positive momentum. The Federal Reserve’s monetary policy remains a dominant factor, with market participants closely scrutinizing inflation data and forward guidance for any hints of a pivot towards easing. The global economic outlook also remains uncertain, with geopolitical tensions and supply chain issues contributing to a risk-averse environment.

Implications for Investors
The re-emergence of the Bitcoin bottom signal, juxtaposed with the prevailing macroeconomic and liquidity challenges, presents a complex investment thesis. While the technical indicators may suggest an impending bullish turn, the broader market conditions imply that any rally may be more measured and potentially subject to greater volatility than the explosive surge witnessed in 2024 following the 2023 bottom.
Investors are faced with a scenario where historical patterns are replaying on the surface, but the underlying fundamentals have shifted. The prolonged stay in the "extreme high risk" zone could indeed be a precursor to a bottom, but the time it takes to consolidate and build sustainable demand will likely be influenced by external factors. The cautious capital flows into gold and the negative sentiment surrounding Bitcoin ETFs suggest that the broader market is not yet fully convinced of a sustained recovery.
The critical price levels identified by analysts like Willy Woo will be closely watched as barometers of market sentiment and strength. Holding these support levels will be crucial for maintaining a positive long-term outlook. Conversely, a decisive break below them could signal a more challenging period ahead.
Ultimately, the current Bitcoin market appears to be at a crossroads. The familiar echoes of a bottoming signal are present, but the symphony of market forces is playing a different tune. Investors will need to navigate this complex landscape with a keen eye on both technical indicators and the evolving macroeconomic and liquidity environment to make informed decisions. The path to the next significant bullish inflection point for Bitcoin may be less a sprint and more a carefully managed marathon, contingent on the resolution of broader economic uncertainties and a renewed surge in robust, sustained demand.