
Bitcoin (BTC) found itself teetering on the brink of establishing a new resistance level as the weekly close approached on Sunday, with traders and analysts diverting significant attention towards the volatile movements in oil and gold markets. The digital asset’s price action over the weekend saw it dip to multiday lows of $66,569, placing it below a critical technical indicator: the 200-day exponential moving average (EMA). This particular trend line, currently situated around $68,310, has proven to be a persistent hurdle for BTC, with repeated attempts to reclaim it as support proving unsuccessful in recent trading sessions.
The implications of failing to secure a weekly close above this pivotal 200-day EMA are significant, according to prominent market observers. The loss of this long-term trend line could solidify it as a formidable resistance zone, potentially signaling a shift in market sentiment and setting the stage for further downside pressure. Historically, the last time BTC/USD experienced a weekly close below this critical moving average was in early March 2023, a period that preceded a significant downturn in the cryptocurrency market.
The Significance of the 200-Day EMA: A Historical Perspective
The 200-day EMA is widely regarded by technical analysts as a key barometer of long-term market health. For Bitcoin, breaching and holding above this level has often been a precursor to sustained bullish momentum, while conversely, falling below it can indicate a loss of upward momentum and the potential for a trend reversal. The current struggle to overcome this threshold underscores the ongoing debate about Bitcoin’s next directional move.
Data from TradingView illustrates the persistent challenge Bitcoin has faced in reclaiming this level. Over the weekend, the BTC/USD pair hovered below the $67,000 mark, indicating a lack of immediate buying pressure to push it back above the psychologically important $68,000 level. This repeated rejection suggests that sellers have been more aggressive in this price vicinity, turning what was previously a potential support into a resistance.

Trader and analyst Rekt Capital highlighted the critical nature of the upcoming weekly close. In a recent X post, he elaborated on the significance of Bitcoin’s price action in relation to the 200-day EMA. "Indeed, Bitcoin has once again wickedly moved beyond the 200 EMA, with price cancelling out the vast amount of the recent rebound," Rekt Capital observed. He further emphasized that a weekly candle close below this key level would serve to "continue to solidify the EMA as resistance." This perspective suggests that a failure to break above the 200-day EMA by the end of the weekly trading period could embolden short-sellers and dampen bullish sentiment among retail and institutional investors alike.
The last instance of Bitcoin closing a weekly candle below the 200-day EMA prior to February occurred in early March 2023. This period was characterized by significant volatility, and the subsequent recovery and eventual surpassing of this EMA in the following months was a key factor in the subsequent bull run. Therefore, market participants are keenly observing whether history will repeat itself in reverse, with the 200-day EMA acting as a ceiling rather than a floor.
Echoes of 2023: A Bullish Counterpoint
Despite the immediate bearish technical signals, some market participants are drawing parallels to Bitcoin’s price action in 2023, suggesting a potential for a repeat of a powerful upside move. Trader Merlijn The Trader pointed to the current price level as being at a similar structural point that initiated a significant rally in the previous year.
In a series of tweets, Merlijn outlined a historical precedent: "BITCOIN IS TESTING THE LEVEL THAT STARTED THE LAST RALLY. In 2023 the 200 EMA acted as the launchpad for the entire move. Price reclaimed it. Retested it. Then exploded higher." He further noted that "BTC is now back at the same structure near $65K."
This perspective offers a more optimistic outlook, positing that the current retest of the 200-day EMA could serve as a similar foundation for a future upward trend. According to this view, if Bitcoin can successfully hold this level as support and then reclaim it decisively, a substantial rally could follow, mirroring the events of 2023. The key, as Merlijn suggests, lies in Bitcoin’s ability to "hold it and continuation follows." The alternative, a decisive break below this level, would signal a different, less favorable outcome.

The visual evidence from trading charts supports Merlijn’s observation. The 2023 chart clearly depicts the 200-day EMA acting as a critical inflection point, after which Bitcoin experienced a significant price appreciation. The current charts show Bitcoin revisiting this same area, creating a compelling visual narrative for those who believe in cyclical market patterns.
Macroeconomic Currents: Oil, Gold, and Bitcoin’s Interplay
Beyond the technical indicators, the broader macroeconomic landscape is playing a significant role in shaping market sentiment and, consequently, Bitcoin’s price trajectory. Heightened geopolitical tensions, particularly the ongoing conflict in the Middle East, have amplified the appeal of traditional safe-haven assets like gold and oil. This shift in focus towards commodities is drawing capital and attention away from riskier assets, including cryptocurrencies.
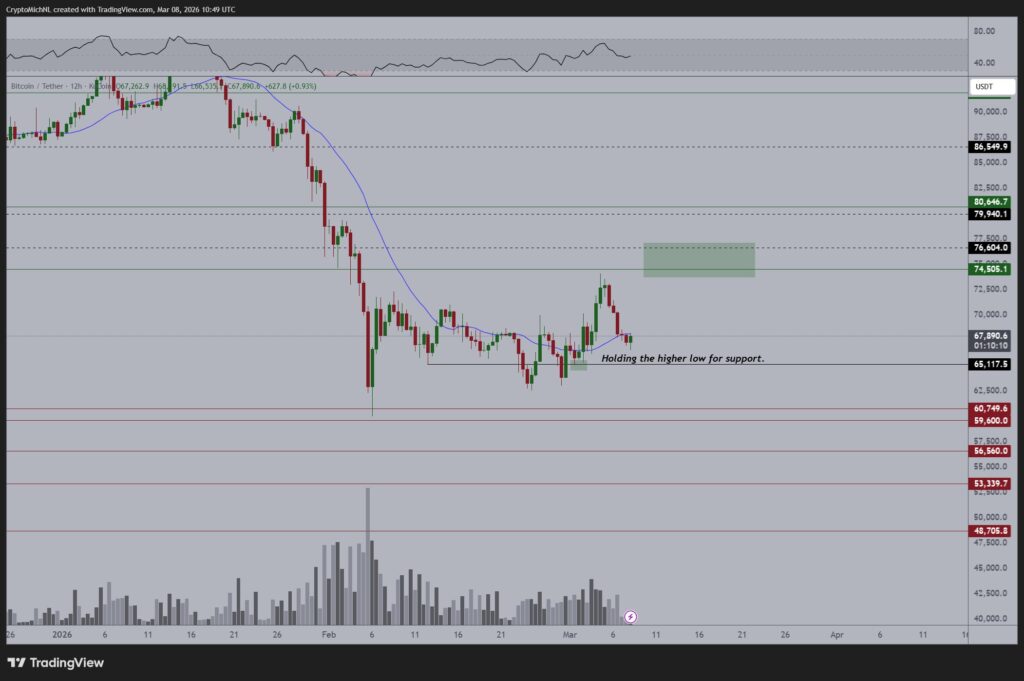
Leading crypto analyst Michaël van de Poppe emphasized the direct correlation between the performance of gold and oil and Bitcoin’s potential for a rebound. In a recent X post, he stated, "All eyes on Oil tomorrow, and Gold & Silver. If those are moving in favor of Bitcoin, we might see a return to the highs in the coming week and the worst is behind us." This sentiment suggests that a stable or rising price in these commodities could indicate a broader risk-on appetite, which would benefit Bitcoin.
Conversely, Van de Poppe also outlined a bearish scenario. He indicated that if these commodities do not move favorably, he would consider becoming a "big buyer in the $60K areas if we test the lows again." This suggests a potential target zone for further accumulation should Bitcoin experience additional downward pressure, implying a belief in the long-term value proposition of Bitcoin even amidst short-term volatility.
The performance of these commodities in the immediate pre-weekend trading sessions provides further context. WTI crude oil, a key benchmark for global oil prices, closed Friday with a notable increase of nearly 16%, reflecting ongoing supply concerns and geopolitical risk premiums. Meanwhile, gold, after a brief attempt to surpass its all-time highs, consolidated its position just below the $5,200 mark.

Bitcoin’s Undervaluation Relative to Gold
Van de Poppe also drew attention to Bitcoin’s valuation relative to gold, suggesting that the digital asset is currently undervalued. He pointed to record low relative strength index (RSI) readings when comparing BTC to Gold, a metric he has consistently monitored. "The valuation of $BTC vs. Gold isn’t changed," he posted on X. "It’s still the lowest RSI in history of that particular metric, which is still: – Gold is overvalued in the short term. – Bitcoin is undervalued in the short term."
The RSI is a momentum oscillator used in technical analysis to measure the speed and change of price movements. A low RSI reading, particularly when comparing two assets, can indicate that one asset has fallen significantly relative to the other and may be poised for a rebound. In this case, Van de Poppe’s analysis suggests that while gold might be experiencing a short-term surge due to its safe-haven status, Bitcoin presents a more compelling long-term investment opportunity due to its current relative undervaluation.
This perspective is supported by the historical data on the BTC/XAU (Bitcoin to Gold) ratio, which has shown a significant decline from its peaks. While gold has historically served as a store of value, Bitcoin is increasingly being viewed by some investors as a digital alternative, offering unique properties such as decentralization and scarcity. The current RSI divergence, as highlighted by Van de Poppe, suggests that the market may be overlooking Bitcoin’s potential in favor of traditional safe havens.
Broader Market Implications and Future Outlook
The interplay between technical indicators, macroeconomic factors, and investor sentiment creates a complex trading environment for Bitcoin. The approaching weekly close is a critical juncture, and the outcome will likely dictate the short-to-medium term price direction.
If Bitcoin successfully breaks above the 200-day EMA and holds it as support, it could trigger a wave of renewed buying interest, potentially leading to a retest of recent highs and further upside momentum. This scenario would be further bolstered by positive developments in the geopolitical landscape and a shift towards a more risk-on market sentiment.

Conversely, a failure to reclaim the 200-day EMA and a subsequent break below key support levels could signal a deeper correction. This would align with a more cautious market environment, where investors prioritize capital preservation amidst global uncertainties. In such a scenario, the $60,000 level, as identified by Van de Poppe, could become a significant area of interest for both buyers and sellers.
The performance of Bitcoin in the coming days will be closely watched not only by cryptocurrency investors but also by traditional financial market participants who are increasingly incorporating digital assets into their portfolios. The ability of Bitcoin to navigate these technical and macro headwinds will be a crucial test of its resilience and its evolving role in the global financial system.
This article does not contain investment advice or recommendations. Every investment and trading move involves risk, and readers should conduct their own research when making a decision. While we strive to provide accurate and timely information, Cointelegraph does not guarantee the accuracy, completeness, or reliability of any information in this article. This article may contain forward-looking statements that are subject to risks and uncertainties. Cointelegraph will not be liable for any loss or damage arising from your reliance on this information.