
Bitcoin’s (BTC) recent attempt at a relief rally has been met with resistance, as the price failed to sustain levels above $74,000 and subsequently retreated below the $68,500 mark. This price action has ignited a debate among market analysts regarding whether the current downturn represents a temporary setback or the continuation of a broader bear market. The critical support zone between $68,000 and $70,000 is now being closely watched, with many believing its retention is crucial for the short-lived bull trend to persist.
The central question on the minds of many traders and investors is whether Bitcoin has reached a market bottom or if further declines are on the horizon. Adding to the complexity, historical data suggests a potential cyclical pattern. Nic, CEO of Coinbureau, shared an analysis on X (formerly Twitter) highlighting that Bitcoin’s price relative to gold has historically taken approximately 14 months to transition from its peak to its trough. Following these historical bottoms in the BTC/gold ratio, the cryptocurrency has consistently experienced sharp rallies exceeding 300%. Given that the current decline in this ratio has spanned 13 months, Nic’s observation suggests that Bitcoin might be nearing a significant turning point.

However, not all market participants share this optimistic outlook. CryptoQuant, an on-chain analytics firm, presented a contrasting view on X, stating that Bitcoin is currently in a bear market, as indicated by their proprietary Bull Score Index, which remains deeply entrenched in bearish territory. According to CryptoQuant’s analysis, the current price movement is likely "just a relief rally, not the start of a new bull phase." This divergence in expert opinions underscores the uncertainty pervading the cryptocurrency market.
The recent market action has seen Bitcoin’s price struggle to maintain upward momentum after rejecting the $74,000 level. This resistance point, coupled with the subsequent drop below $68,500, has introduced a degree of caution among investors. The $68,000 to $70,000 zone is now considered a pivotal area. A sustained hold above this range could signal a continuation of bullish sentiment, while a decisive break below it might indicate a further descent into bearish territory.
Bitcoin Price Analysis: Navigating Key Support Levels
Bitcoin’s price action over the past few days has been characterized by a sharp reversal after touching the $74,508 breakdown level on Thursday. This rejection signifies the robust defense of this level by bearish forces, indicating that significant selling pressure emerges when Bitcoin attempts to ascend further.

The 20-day exponential moving average (EMA), currently situated at $69,003, has emerged as a critical support level to monitor. Should Bitcoin’s price find support and bounce off this 20-day EMA, bulls may attempt another assault on the $74,508 resistance. A successful breach of this level could propel the BTC/USDT pair towards the $84,000 mark, potentially signaling that the market has bottomed out around the $60,000 level.
Conversely, a sustained close below the 20-day EMA would likely lead to a further price decline, with the next significant support line coming into play. A break below this crucial support line would decisively shift the advantage to the bears, potentially triggering a steeper correction towards the $60,000 level. The interplay between these key moving averages and price levels will be crucial in determining Bitcoin’s short-to-medium term trajectory.
Ether Price Outlook: Navigating Consolidation Amidst Resistance
Ethereum (ETH), the second-largest cryptocurrency by market capitalization, experienced a brief breakout above the $2,111 resistance on Wednesday, only to be pulled back below this level by bearish forces on Thursday. This price action suggests a market rejection of the higher price levels, indicating that selling pressure remains significant.

The ETH/USDT pair has subsequently moved lower and broken below the 20-day EMA, which currently stands at $2,032. This development implies that the market is signaling a potential period of consolidation. Analysts anticipate that Ether might oscillate within a defined range, likely between $1,750 and $2,200, for the foreseeable future as market participants assess the next directional move.
However, a potential bullish scenario exists if the price rebounds from current levels and manages to break above the 50-day simple moving average (SMA), currently at $2,328. Such a move would indicate a weakening of selling pressure and could pave the way for an upward movement towards the $2,600 target. This would suggest that the recent pullback was a temporary pause rather than a reversal of the broader upward trend.
BNB Price Dynamics: Testing Key Support Zones
BNB, the native token of the Binance ecosystem, also encountered resistance, turning down from the $670 level on Thursday. This indicates that sellers are actively defending this price point, preventing further upward momentum.

The bears have successfully pushed the BNB price below the 20-day EMA, which is currently at $637. This breach suggests a temporary loss of bullish momentum, with bulls appearing to have capitulated at these lower levels. Consequently, the BNB/USDT pair is expected to remain range-bound, likely trading between $570 and $670 for an extended period.
A significant shift in favor of the bulls would occur with a sustained close above the $670 level. Such a breakout could open the path for a rally towards the 50-day SMA at $718 and potentially extend to $790. Conversely, sellers would regain a stronger foothold if they manage to drive the BNB price below the $570 support level, which could initiate a new leg of the downtrend, targeting the $500 mark.
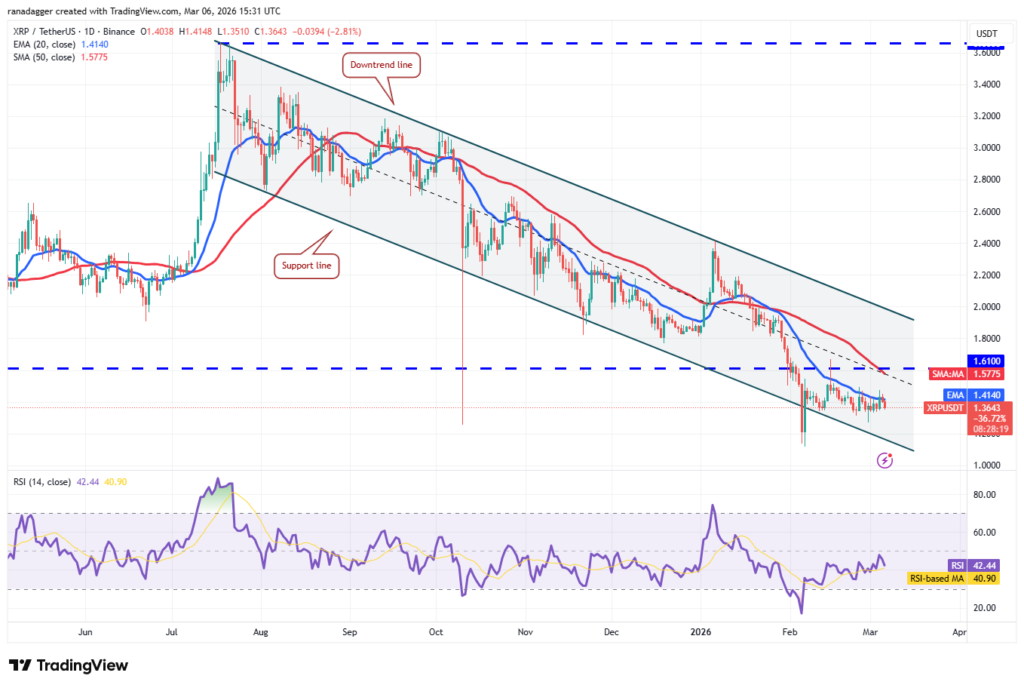
XRP Price Trajectory: Awaiting Clearer Direction
XRP managed to close above the 20-day EMA ($1.41) on Wednesday, offering a glimmer of hope for bulls. However, this positive momentum could not be sustained, and the bulls were unable to hold the higher price levels.

Currently, bears are attempting to pull the XRP/USDT pair below the critical $1.27 support. A decisive break below this level would be a significant bearish signal, potentially leading to a sharp decline towards the support line of the descending channel pattern. This pattern, if completed, suggests further downside potential.
On the other hand, a reversal and subsequent break above the 20-day EMA would indicate a potential comeback for the bulls. Such a move could trigger a rally towards the $1.61 level, which has historically acted as a strong resistance point. The battle between these two key levels will dictate XRP’s immediate future.
Solana Price Action: Balancing Supply and Demand
Solana (SOL) experienced a pullback from the $95 level on Thursday, subsequently slipping below its 20-day EMA, which is currently positioned at $86. This price action indicates a weakening of bullish sentiment in the short term.

The 20-day EMA is exhibiting a relatively flat trajectory, and the Relative Strength Index (RSI) is hovering just below the midpoint. These indicators suggest a temporary balance between supply and demand in the market. As a result, the Solana price is likely to remain within a trading range, potentially oscillating between $76 and $95 for the next few days.
For buyers to regain control and signal a weakening grip by the bears, a sustained close above the $95 level is essential. Such a breakout could propel the SOL/USDT pair towards the $117 level. Conversely, sellers would reassert their dominance if the price closes below the $76 support, indicating further downside pressure.
Dogecoin Price Movements: Testing Crucial Support
Dogecoin (DOGE) saw a brief uptick above its 20-day EMA ($0.10) on Wednesday, but failed to breach the 50-day SMA ($0.11). This resistance at the higher moving average suggests that the bears remain active in defending these levels.

The Dogecoin price has since reversed and fallen back to the critical $0.09 support level. A break below this support would be a significant bearish development, potentially leading to a retest of the February 6th low of $0.08. Buyers are expected to strongly defend this $0.08 level, as a sustained close below it could trigger a sharp decline towards $0.06.
For bulls to signal strength, they must drive the price decisively above the 50-day SMA. A successful push above this level could initiate a rally towards the $0.12 breakdown level, where further selling pressure is anticipated.
Cardano Price Analysis: Holding Key Support
Cardano (ADA) buyers made an attempt to push the price above the 20-day EMA ($0.27) on Thursday, but their efforts were met with firm resistance from bearish forces. Despite this, a minor positive for the bulls is their success in preventing the Cardano price from dipping below the $0.25 level.

If the price rebounds from current levels or holds the $0.25 support, bulls will likely attempt to push the ADA/USDT pair towards the downtrend line of the descending channel pattern. This represents a potential upward target.
Conversely, a sustained close below the $0.25 level would open the door for a retest of the support line within the descending channel. A break below this support line could lead to a significant decline, with the pair potentially falling to the $0.15 level.
Bitcoin Cash Price Prediction: Navigating a Potential Pattern
The bounce off the $443 level for Bitcoin Cash (BCH) proved short-lived, fizzling out at $476 on Wednesday. This indicates a prevailing negative sentiment in the market for BCH.

Bears will likely aim to consolidate their position by pushing the Bitcoin Cash price below the $443 support. A breach of this level would complete a bearish head-and-shoulders pattern, a technically bearish formation that often precedes significant price declines. If this pattern materializes, the BCH/USDT pair could plummet to the $375 target.
To signal strength, buyers must propel the price above the 20-day EMA, currently at $488. A successful move above this level could lead to a test of the 50-day SMA at $533, which is expected to act as a significant resistance. A decisive close above the 50-day SMA would indicate the commencement of a sustained recovery, potentially targeting the $600 level.
Hyperliquid Price Outlook: Awaiting a Catalyst
Hyperliquid (HYPE) has recently pulled back to its moving averages, which are now serving as a crucial support zone. The immediate future of HYPE will likely depend on its ability to find support at these levels.

If the Hyperliquid price rebounds with force from its moving averages, bulls will likely attempt to drive the HYPE/USDT pair towards the overhead resistance at $36.77. A sustained close above this level would signal the initiation of a new upward trend.
However, if the price continues its downward trajectory and breaks below the moving averages, it suggests that the pair may remain range-bound between $20.82 and $36.77 for an extended period, indicating a lack of clear directional conviction.
Monero Price Dynamics: Testing Resistance and Support
Buyers are currently attempting to push Monero (XMR) above the $360 level, but they are encountering significant resistance from bearish forces. This indicates that sellers are actively defending higher price points.

The 20-day EMA, currently at $347, is identified as the crucial support level to watch on the downside. If the Monero price finds support and bounces off this 20-day EMA, the probability of breaking above the 50-day SMA ($396) increases. Such a move could propel the XMR/USDT pair towards the 61.8% Fibonacci retracement level at $414.
Conversely, if the price turns down and breaks below the 20-day EMA, it would signal that bearish sentiment is strengthening at higher levels. This scenario could lead to the pair remaining range-bound between $384 and $302 for some time, indicating a period of consolidation or indecision.
The cryptocurrency market’s current volatility underscores the importance of careful analysis and risk management. As Bitcoin and its altcoin counterparts navigate these crucial support and resistance levels, investors will be closely watching for definitive signals that could indicate a sustained trend reversal or a continuation of the current market sentiment. The coming days and weeks are likely to be pivotal in shaping the short-term outlook for the broader digital asset landscape.